

1. Introduction to Plotly
Plotly is a powerful Python library used for creating interactive, publication-quality, and web-based visualizations.Features
- Interactive graphs (zoom, pan, hover)
- 2D and 3D plotting
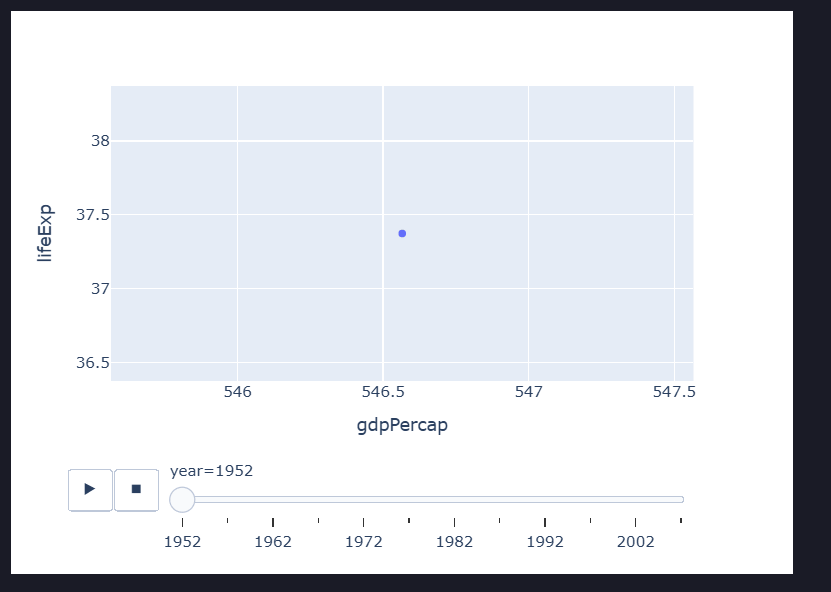
- Animation support
- Statistical charts
- Geographic maps
- Dashboard integration with Dash
- Export graphs as HTML, PNG, PDF, SVG
2. Installation
3. Plotly Modules
4. Plotly Express
Plotly Express is the easiest interface. Example: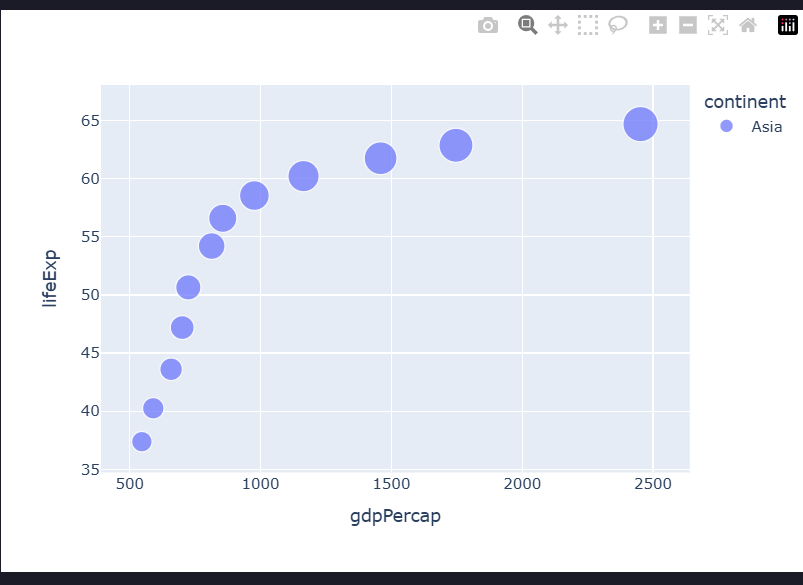
5. Basic Charts
A. Line Chart
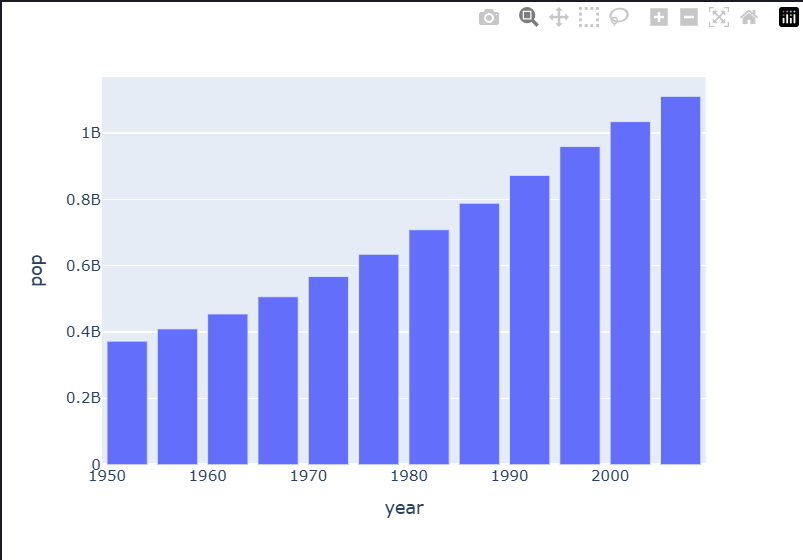
B. Scatter Plot
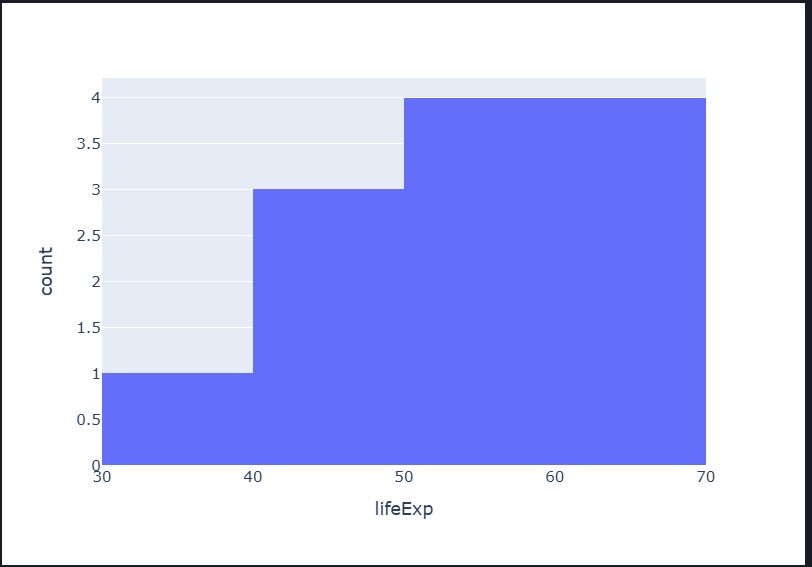
C. Bar Chart
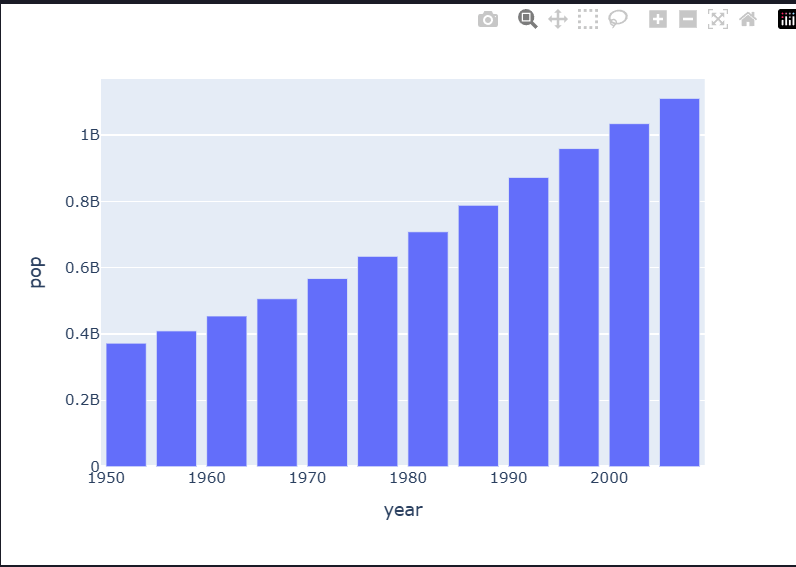
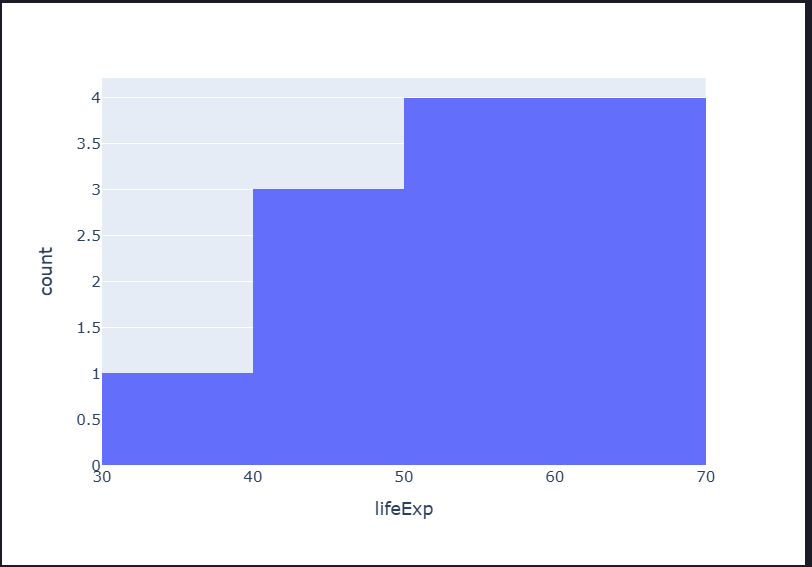
D. Histogram
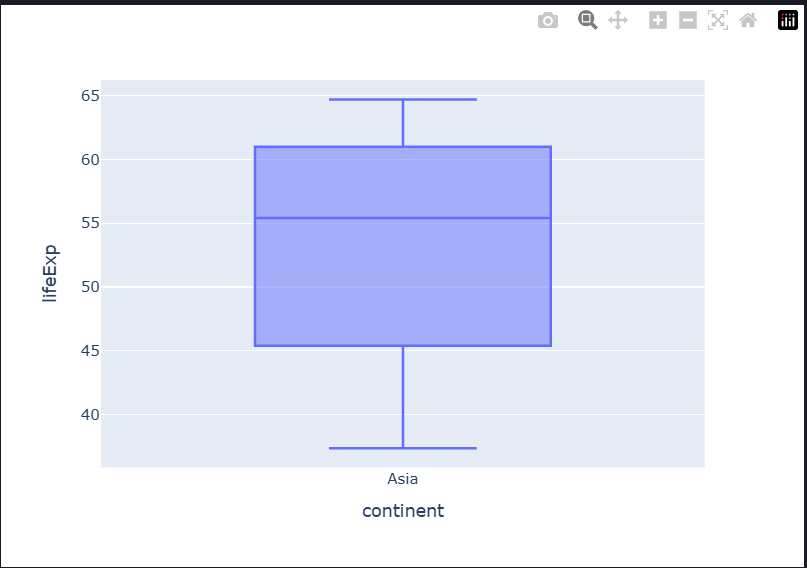
E. Box Plot
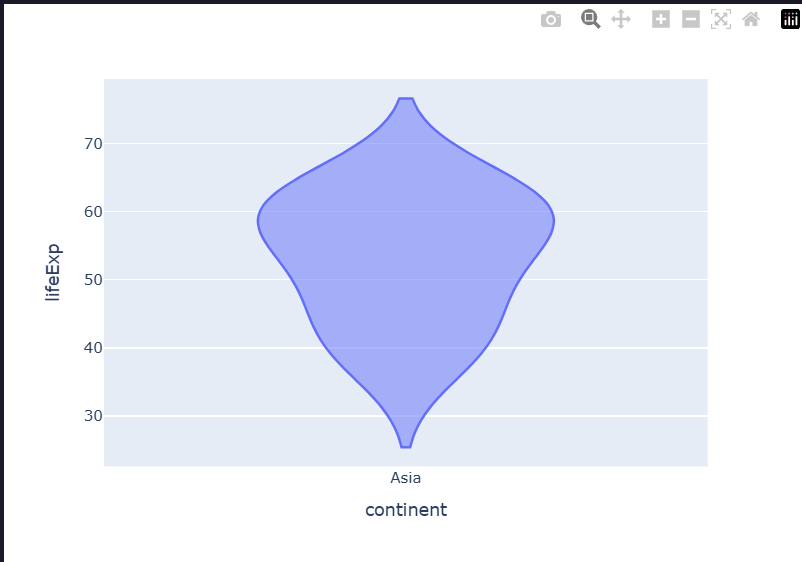
F. Violin Plot
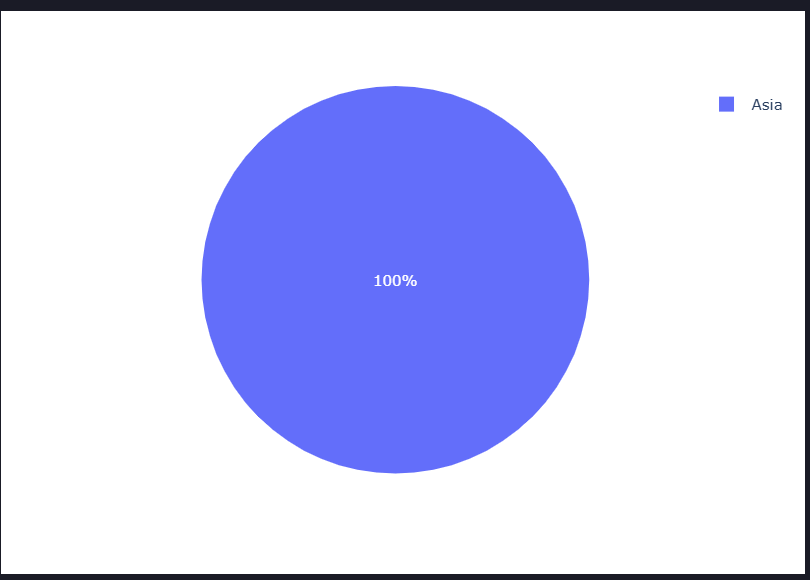
G. Pie Chart
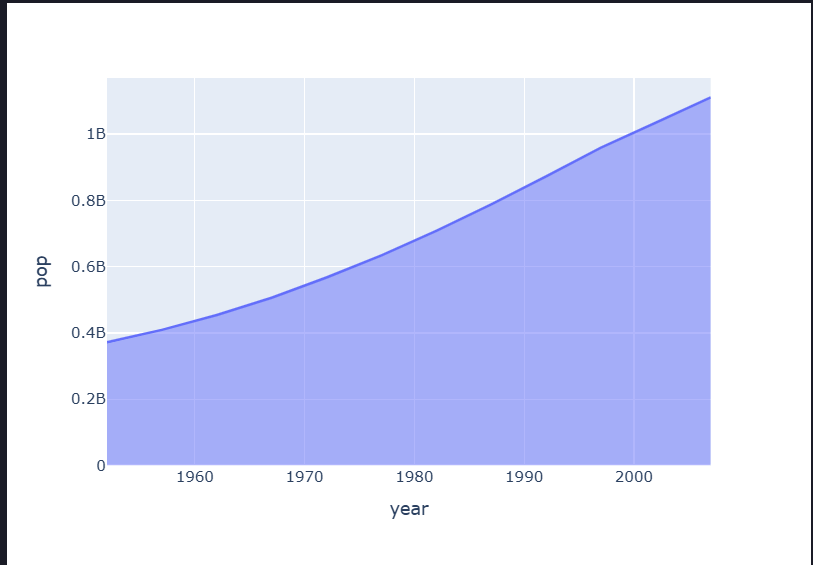
H. Area Chart
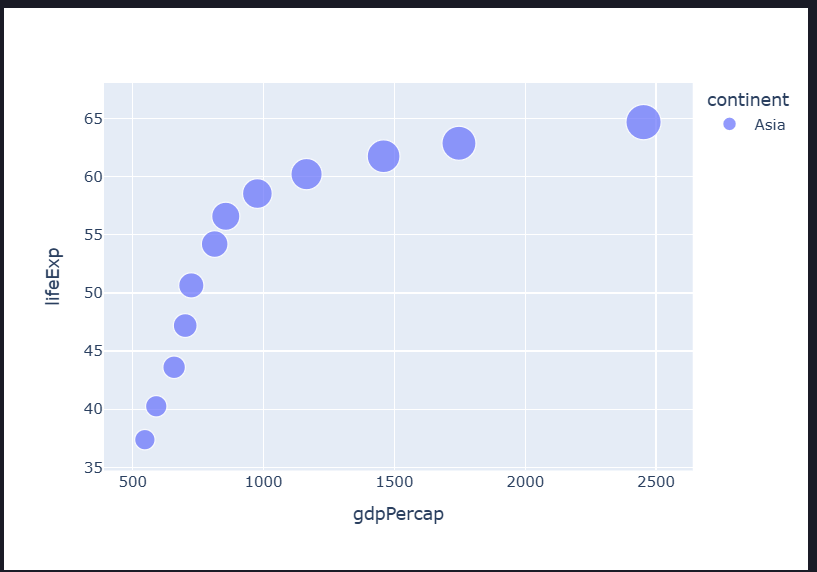
6. Bubble Chart
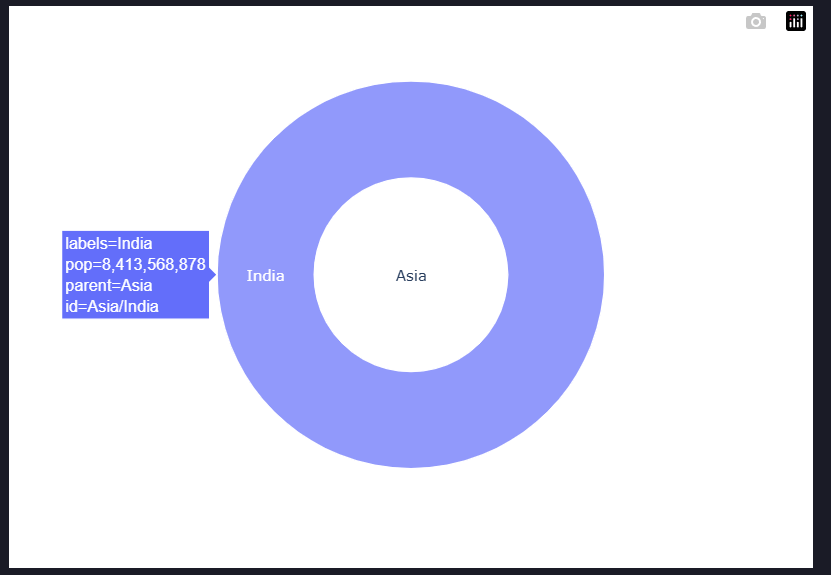
7. Sunburst Chart
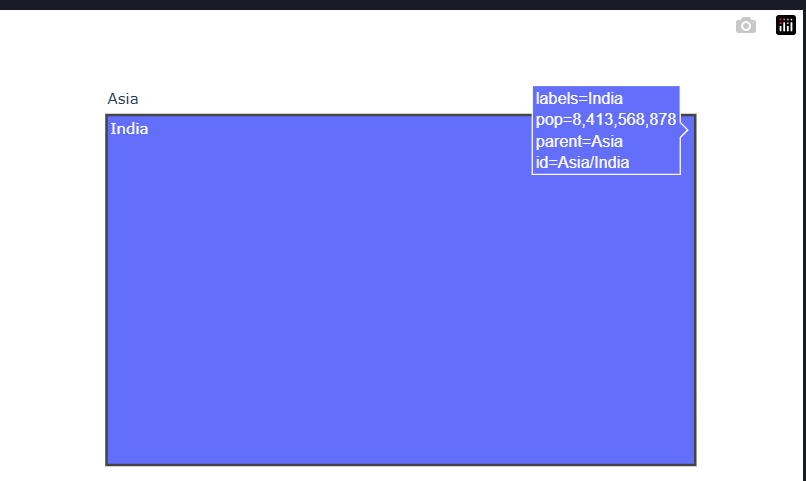
8. Treemap
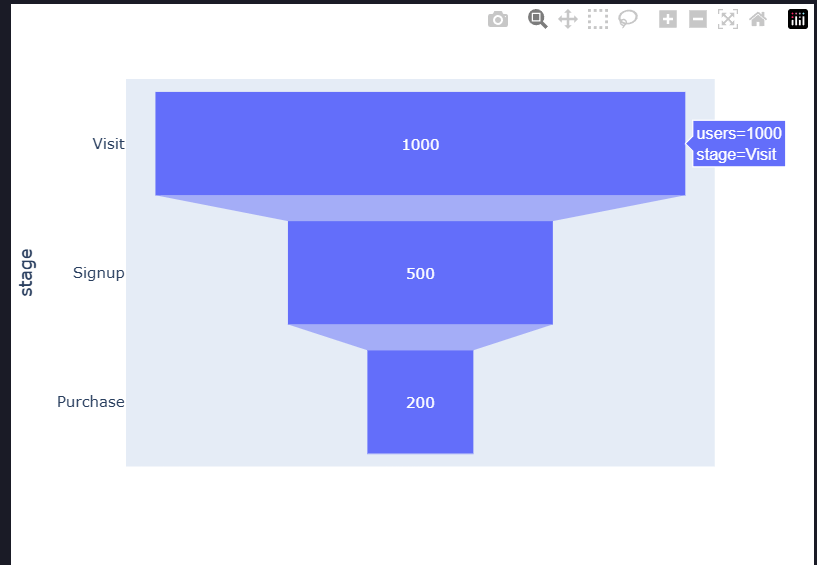
9. Funnel Chart
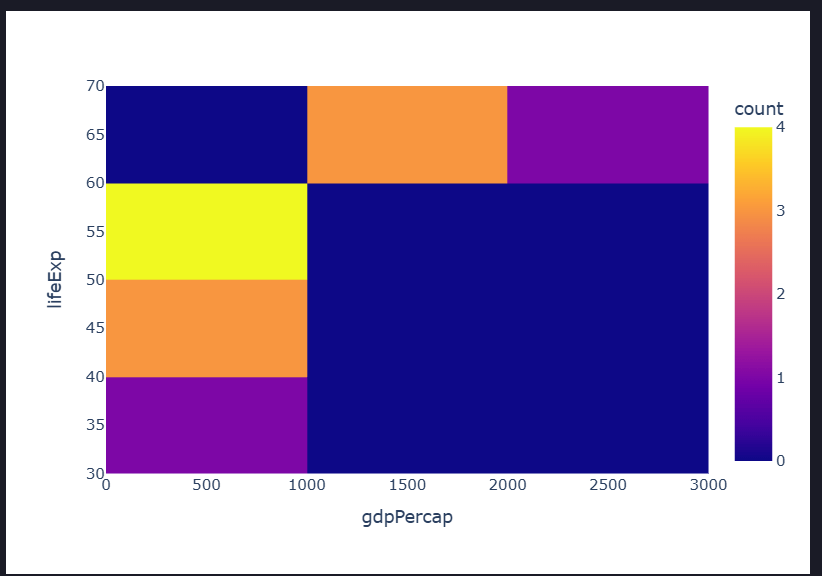
10. Density Heatmap
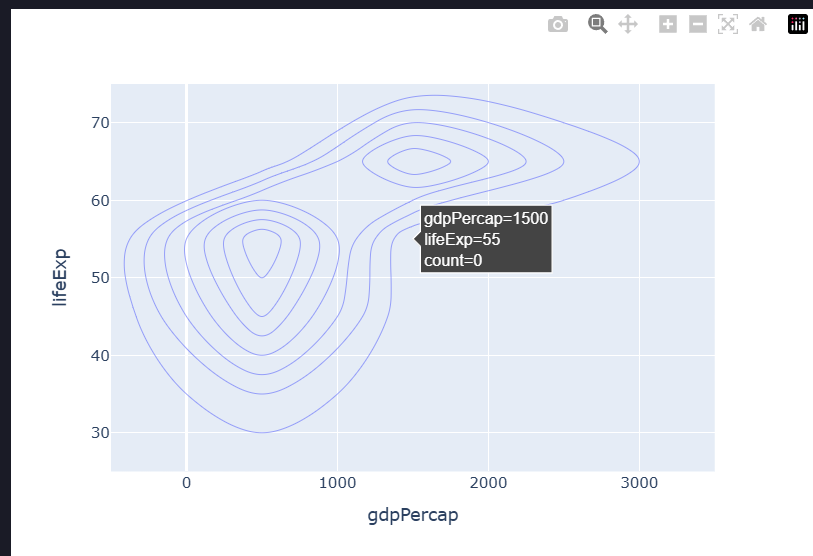
11. Density Contour
12. Choropleth Map
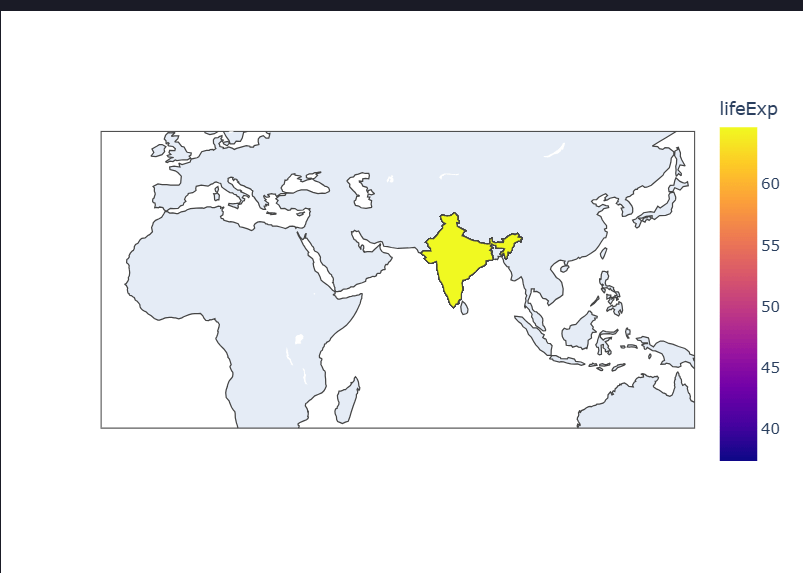
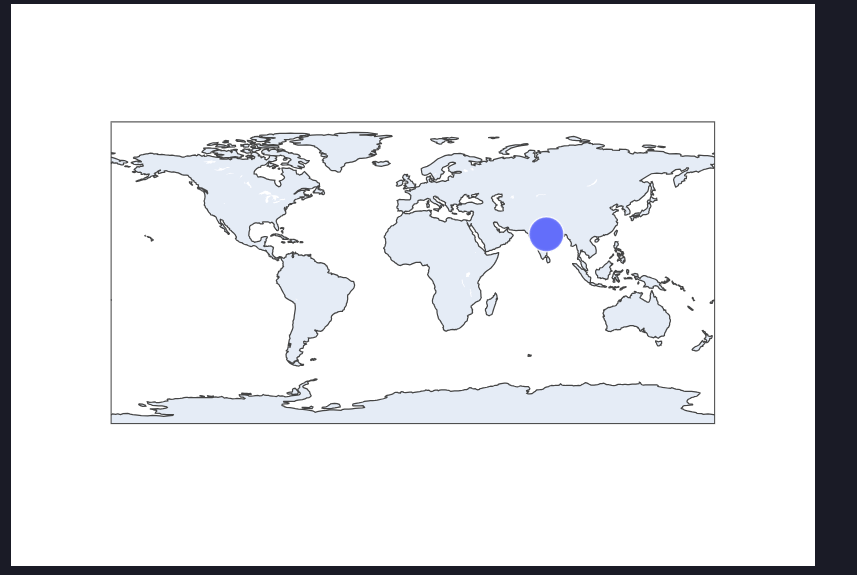
13. Scatter Geo
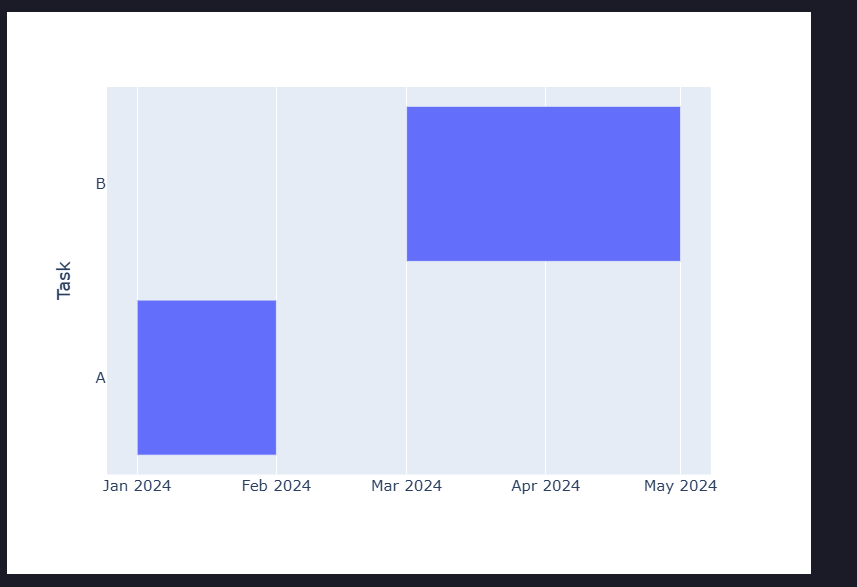
14. Timeline Chart
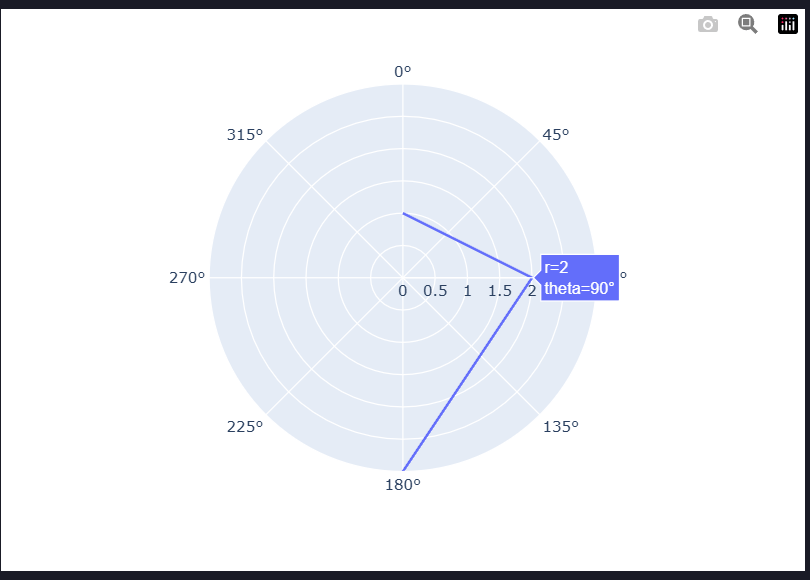
15. Polar Chart
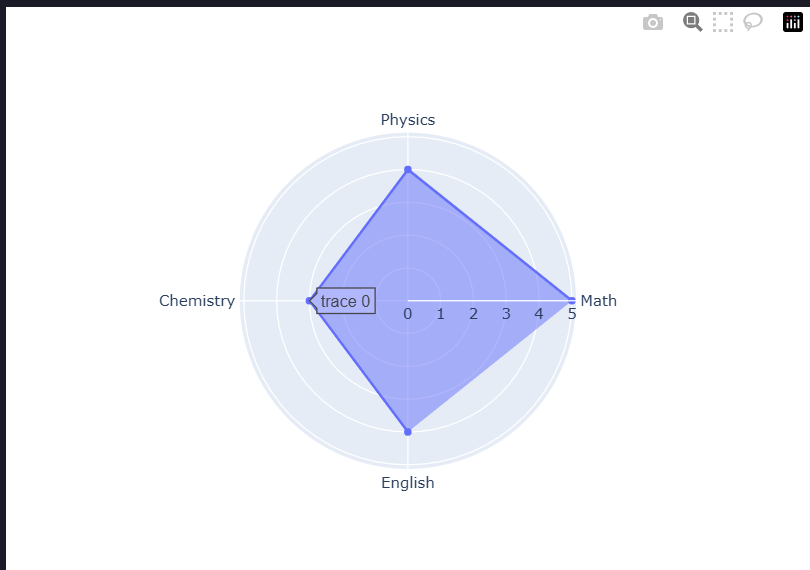
16. Radar Chart
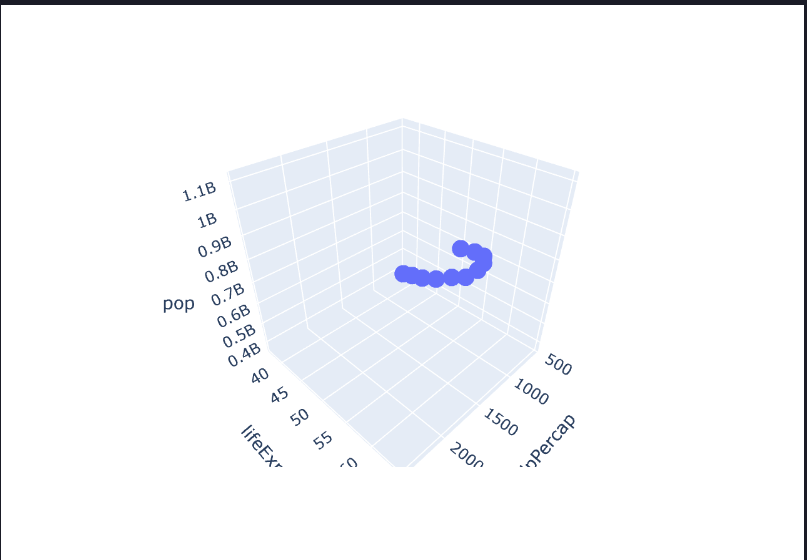
17. 3D Scatter Plot
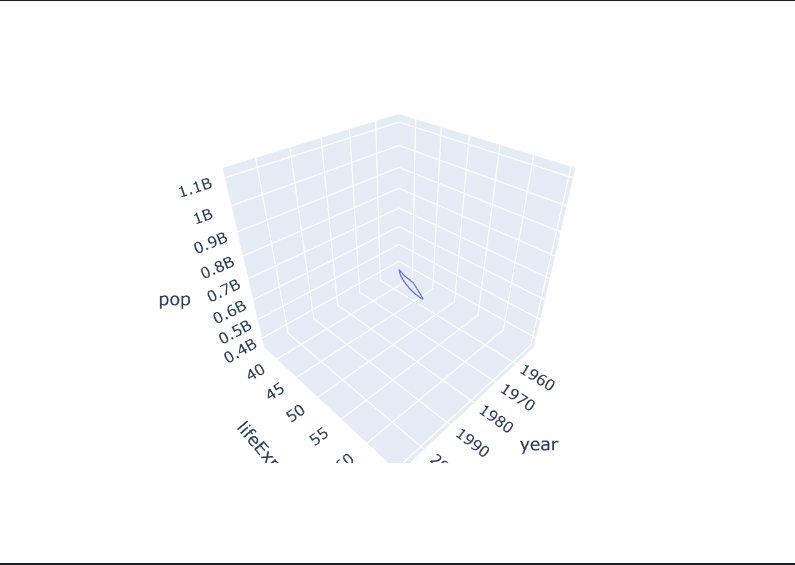
18. 3D Line Plot
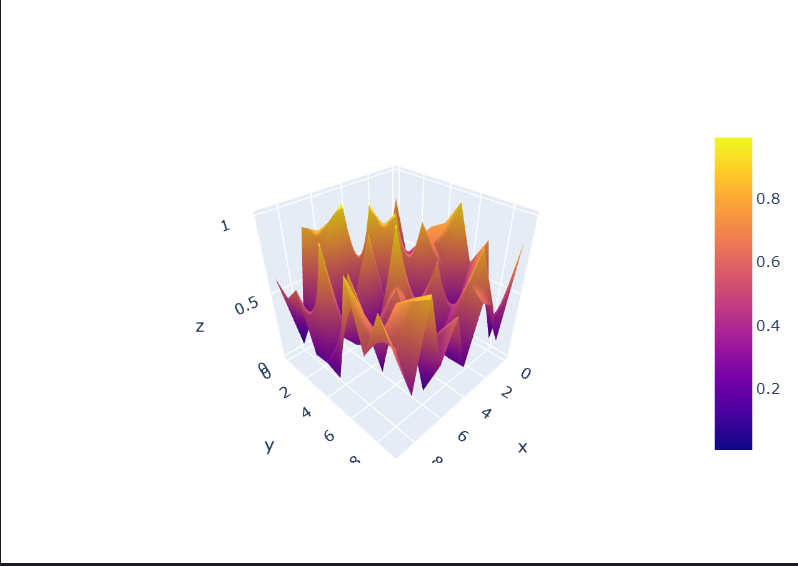
19. Surface Plot
20. Mesh3D
21. Graph Objects
Graph Objects provide full control.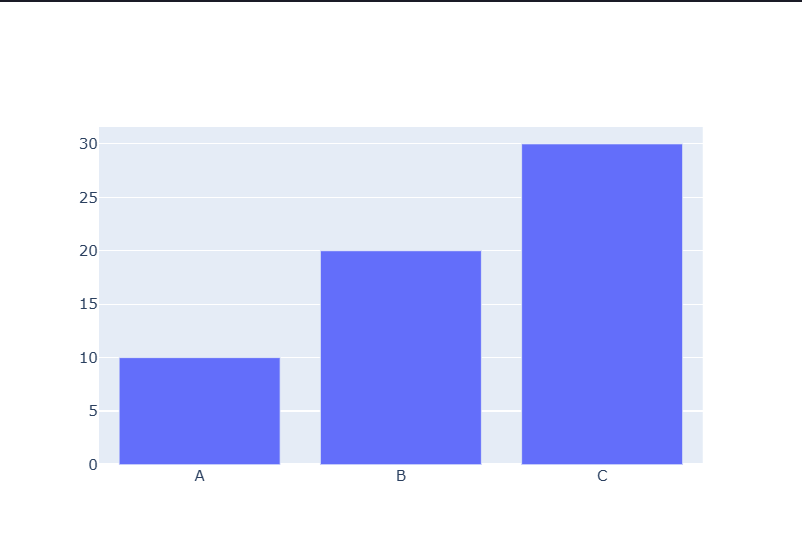
22. Figure Layout
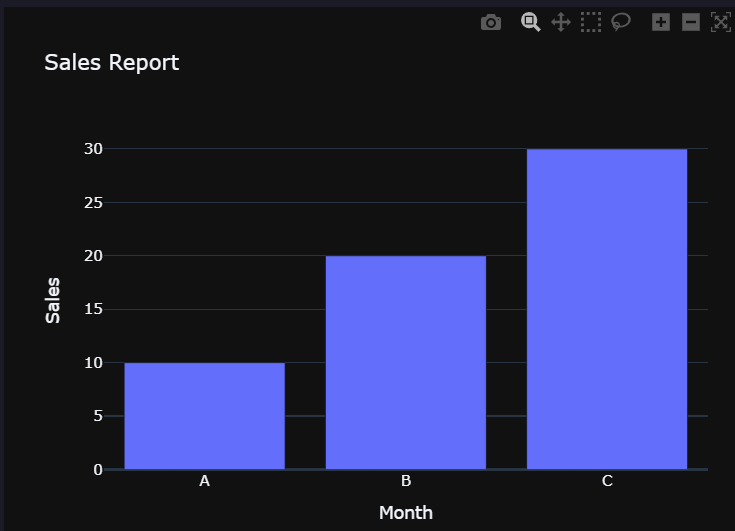
23. Templates
24. Multiple Traces
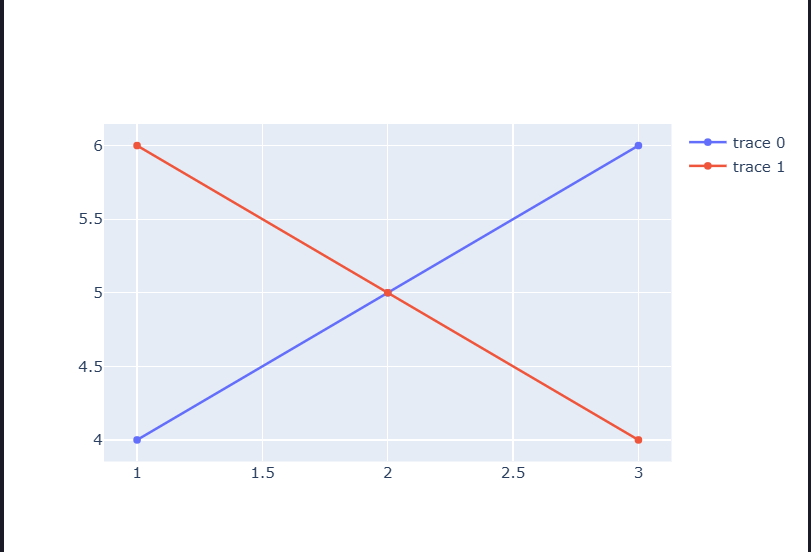
25. Subplots
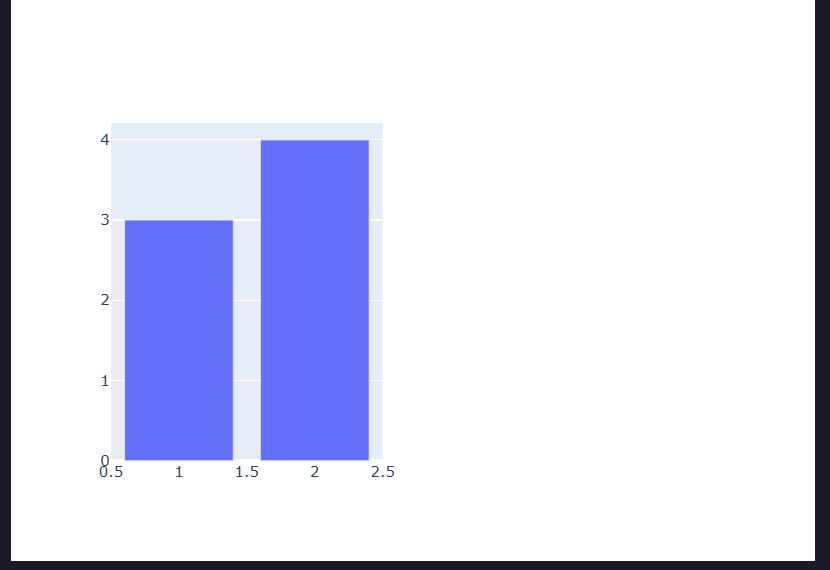
26. Update Traces
27. Update Axes
28. Hover Information
29. Annotations
30. Shapes
Rectangle:31. Animation
32. Export Graph
HTML:kaleido package.)
33. Display Figure
34. Common Plotly Express Parameters
35. Common Graph Objects
go.Scattergo.Bargo.Piego.Boxgo.Violingo.Histogramgo.Heatmapgo.Surfacego.Mesh3dgo.Scatter3dgo.Scatterpolargo.Indicatorgo.Tablego.Funnel
36. Advantages of Plotly
- Interactive visualizations
- Browser-based rendering
- Publication-quality graphics
- Supports 2D and 3D charts
- Easy integration with Dash
- Highly customizable
- Animation support
- Hover tooltips and zooming
- Export to HTML and images
37. Limitations
- Can be slower with very large datasets
- More memory-intensive than static libraries
- Some advanced exports require additional packages (such as
kaleido)
38. Plotly vs Matplotlib
39. Summary
- Plotly Express (
px) is ideal for quickly creating interactive charts. - Graph Objects (
go) provide fine-grained control and customization. - Key chart types: Line, Scatter, Bar, Pie, Histogram, Box, Violin, Heatmap, Treemap, Sunburst, Funnel, Timeline, Polar, 3D Scatter, Surface, Mesh3D, and Geographic Maps.
- Core workflow: Create a
Figure, add traces (if usinggo), customize withupdate_layout(),update_traces(), andupdate_xaxes()/update_yaxes(), then display withfig.show()or export withwrite_html()/write_image().