> ## Documentation Index
> Fetch the complete documentation index at: https://ai.tharung.in/llms.txt
> Use this file to discover all available pages before exploring further.
# Plotly
## 1. Introduction to Plotly
**Plotly** is a powerful Python library used for creating **interactive**, **publication-quality**, and **web-based visualizations**.
### Features
* Interactive graphs (zoom, pan, hover)
* 2D and 3D plotting
* Animation support
* Statistical charts
* Geographic maps
* Dashboard integration with Dash
* Export graphs as HTML, PNG, PDF, SVG
***
# 2. Installation
```bash theme={null}
pip install plotly
```
For Jupyter Notebook:
```bash theme={null}
pip install notebook
```
Import Plotly:
```python theme={null}
import plotly.express as px
import plotly.graph_objects as go
```
***
# 3. Plotly Modules
| Module | Purpose |
| ----------------------------- | ----------------------- |
| plotly.express (px) | Quick plotting |
| plotly.graph\_objects (go) | Advanced customization |
| plotly.subplots | Multiple plots |
| plotly.figure\_factory | Special charts |
| [plotly.io](http://plotly.io) | Save and export figures |
***
# 4. Plotly Express
Plotly Express is the easiest interface.
Example:
```python theme={null}
import plotly.express as px
df = px.data.iris()
fig = px.scatter(df,
x="sepal_width",
y="sepal_length",
color="species")
fig.show()
```
 ***
# 5. Basic Charts
## A. Line Chart
```python theme={null}
import plotly.express as px
df = px.data.gapminder().query("country=='India'")
fig = px.line(df,
x="year",
y="lifeExp",
title="Life Expectancy")
fig.show()
```
***
# 5. Basic Charts
## A. Line Chart
```python theme={null}
import plotly.express as px
df = px.data.gapminder().query("country=='India'")
fig = px.line(df,
x="year",
y="lifeExp",
title="Life Expectancy")
fig.show()
```
 ***
## B. Scatter Plot
```python theme={null}
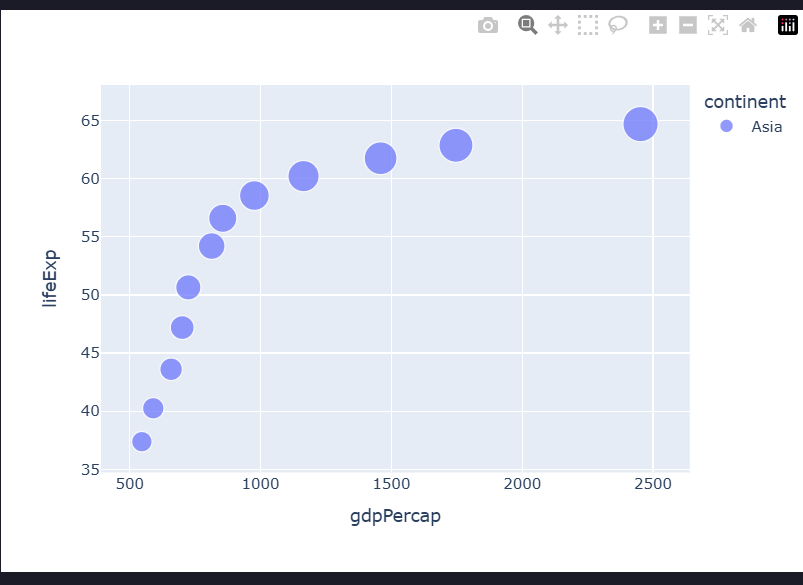
fig = px.scatter(df,
x="gdpPercap",
y="lifeExp",
color="continent",
size="pop")
```
***
## B. Scatter Plot
```python theme={null}
fig = px.scatter(df,
x="gdpPercap",
y="lifeExp",
color="continent",
size="pop")
```
 ***
## C. Bar Chart
```python theme={null}
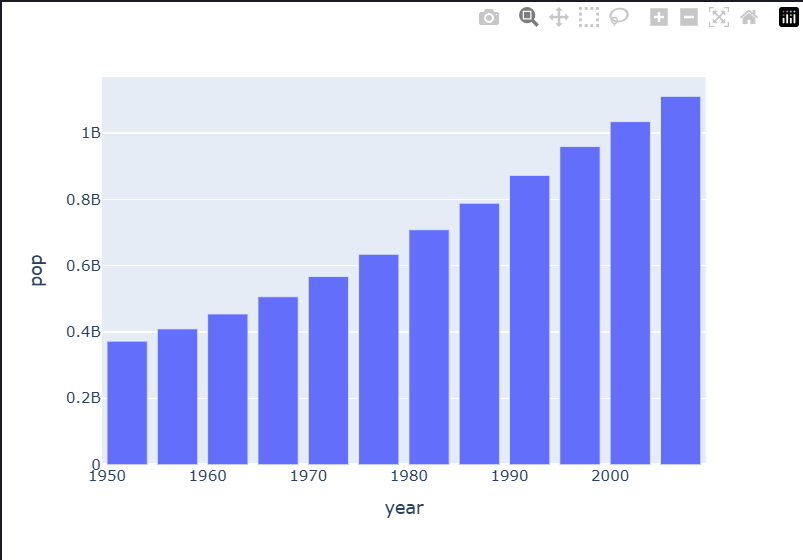
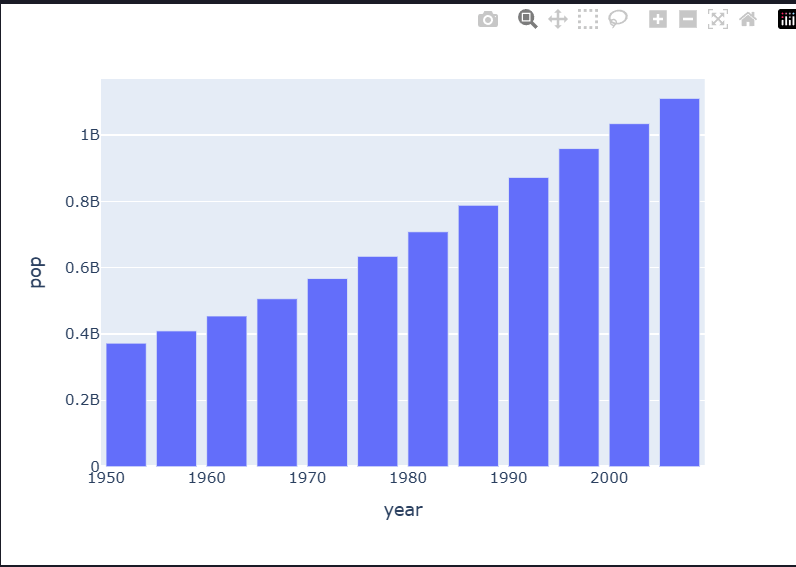
fig = px.bar(df,
x="year",
y="pop"
```
***
## C. Bar Chart
```python theme={null}
fig = px.bar(df,
x="year",
y="pop"
```
 ***
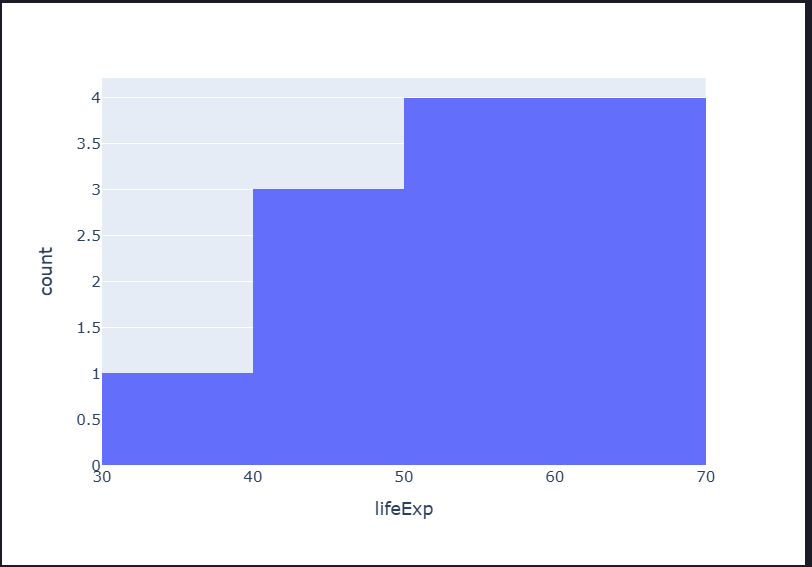
## D. Histogram
```python theme={null}
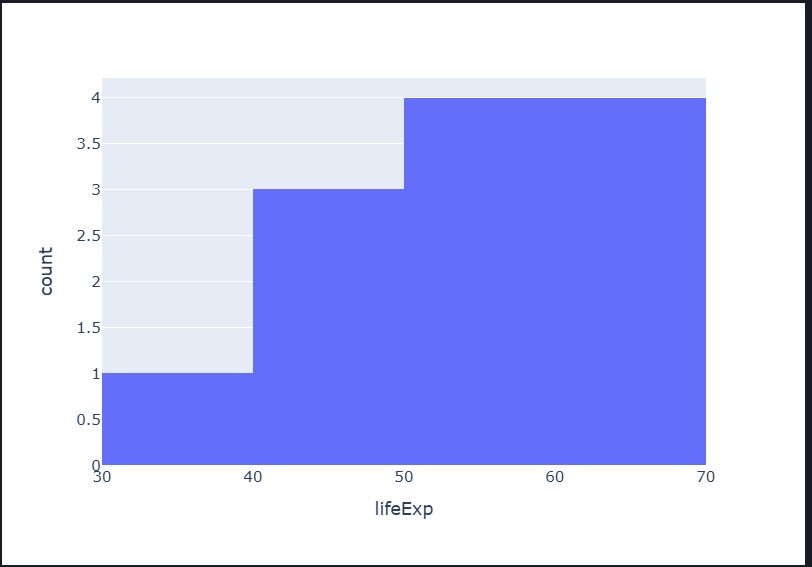
fig = px.histogram(df,
x="lifeExp")
```
***
## D. Histogram
```python theme={null}
fig = px.histogram(df,
x="lifeExp")
```
 ***
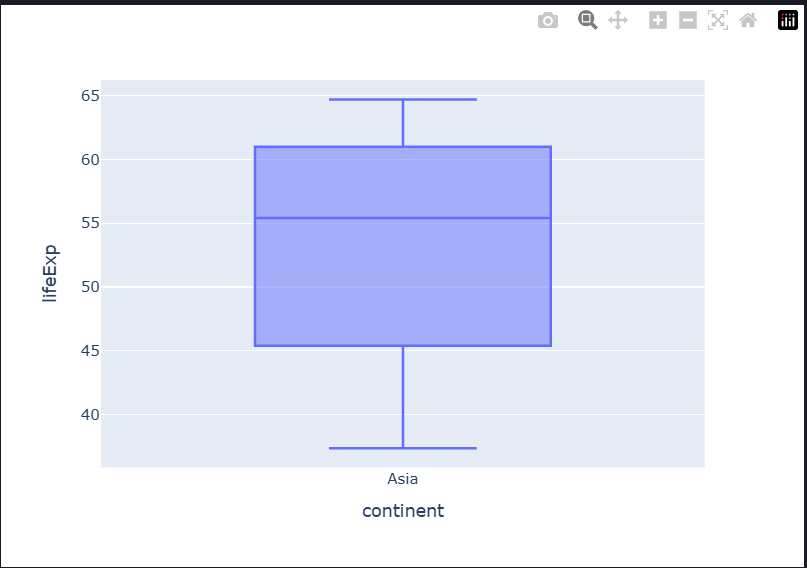
## E. Box Plot
```python theme={null}
fig = px.box(df,
x="continent",
y="lifeExp")
```
***
## E. Box Plot
```python theme={null}
fig = px.box(df,
x="continent",
y="lifeExp")
```
 ***
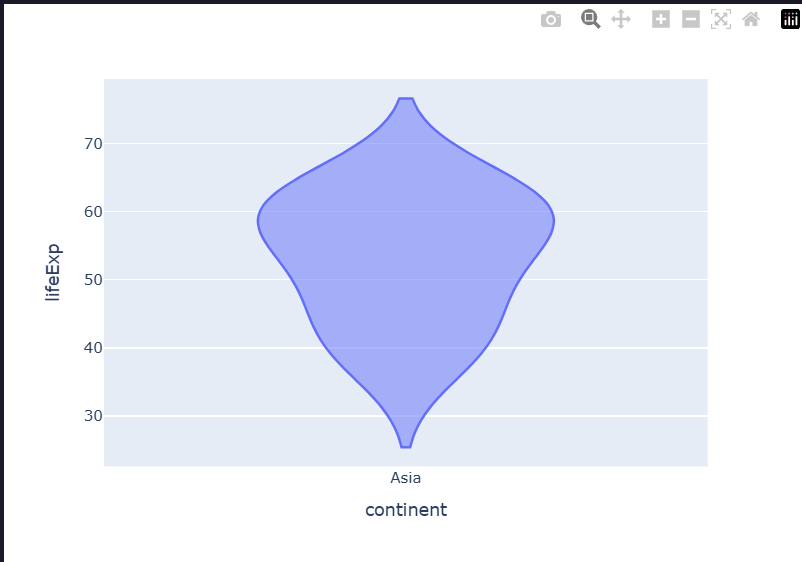
## F. Violin Plot
```python theme={null}
fig = px.violin(df,
x="continent",
y="lifeExp")
```
***
## F. Violin Plot
```python theme={null}
fig = px.violin(df,
x="continent",
y="lifeExp")
```
 ***
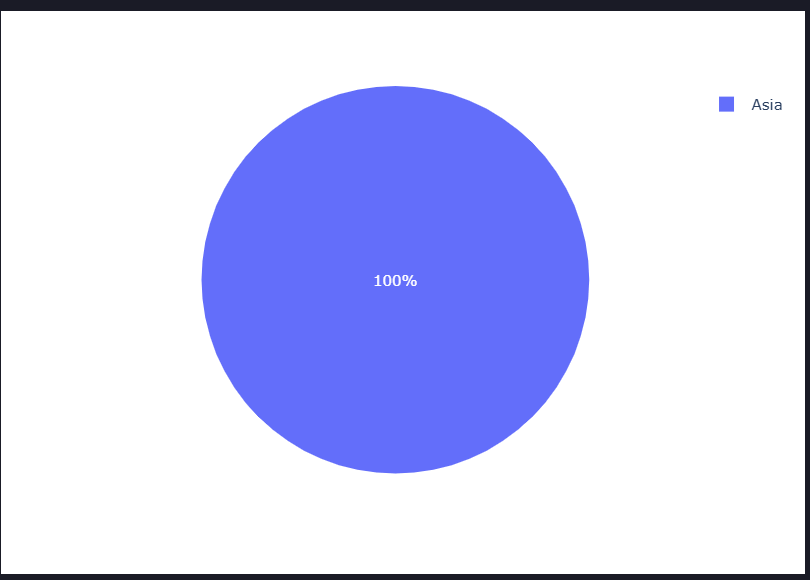
## G. Pie Chart
```python theme={null}
fig = px.pie(df,
names="continent",
values="pop")
```
***
## G. Pie Chart
```python theme={null}
fig = px.pie(df,
names="continent",
values="pop")
```
 ***
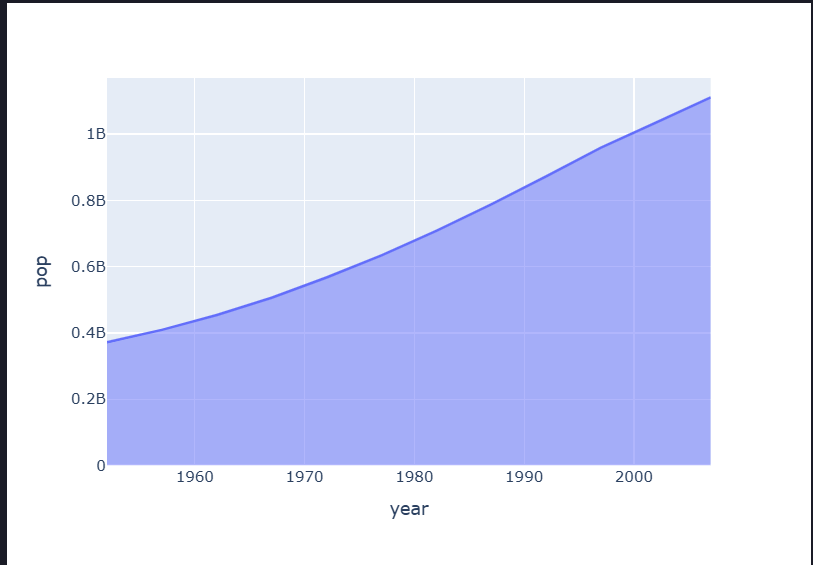
## H. Area Chart
```python theme={null}
fig = px.area(df,
x="year",
y="pop")
```
***
## H. Area Chart
```python theme={null}
fig = px.area(df,
x="year",
y="pop")
```
 ***
# 6. Bubble Chart
```python theme={null}
fig = px.scatter(
df,
x="gdpPercap",
y="lifeExp",
size="pop",
color="continent"
)
```
***
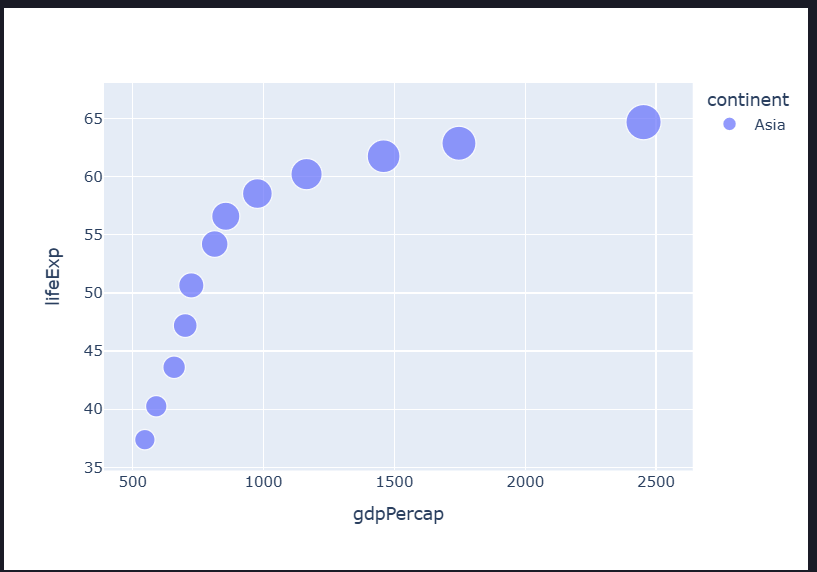
# 6. Bubble Chart
```python theme={null}
fig = px.scatter(
df,
x="gdpPercap",
y="lifeExp",
size="pop",
color="continent"
)
```
 ***
# 7. Sunburst Chart
```python theme={null}
fig = px.sunburst(
df,
path=["continent", "country"],
values="pop"
)
```
***
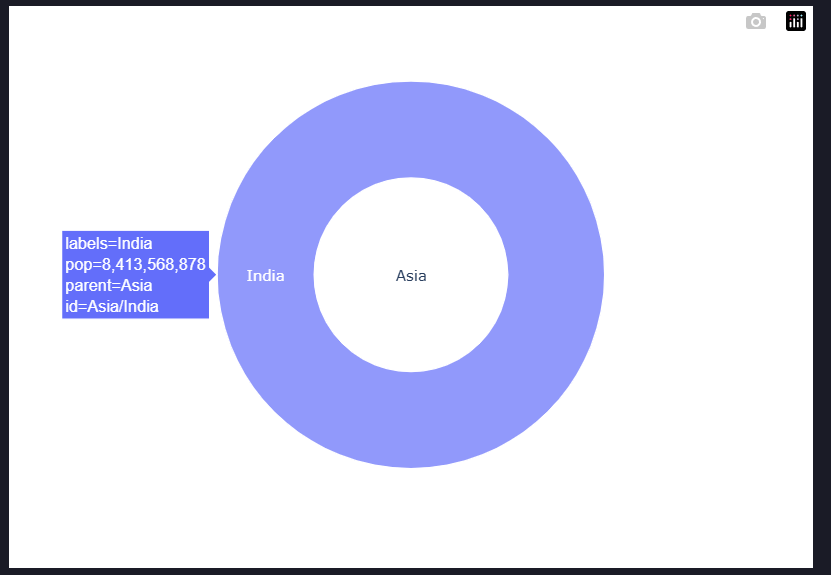
# 7. Sunburst Chart
```python theme={null}
fig = px.sunburst(
df,
path=["continent", "country"],
values="pop"
)
```
 ***
# 8. Treemap
```python theme={null}
fig = px.treemap(
df,
path=["continent", "country"],
values="pop"
)
```
***
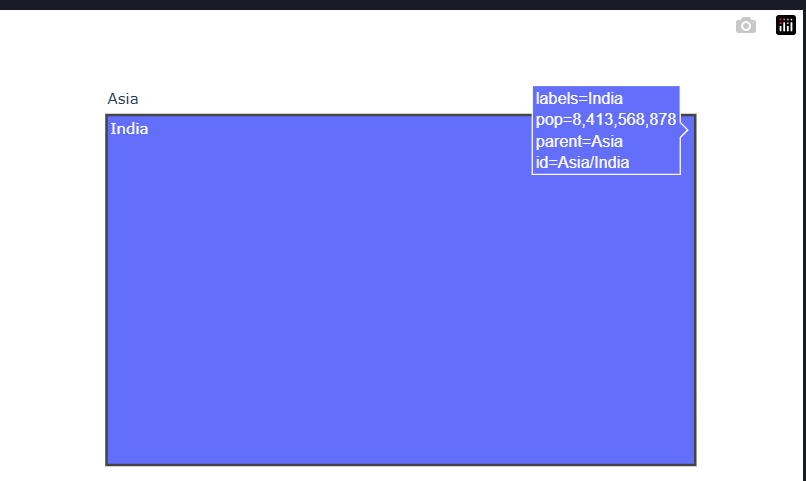
# 8. Treemap
```python theme={null}
fig = px.treemap(
df,
path=["continent", "country"],
values="pop"
)
```
 ***
# 9. Funnel Chart
```python theme={null}
data = dict(
stage=["Visit","Signup","Purchase"],
users=[1000,500,200]
)
fig = px.funnel(
data,
x="users",
y="stage"
)
```
***
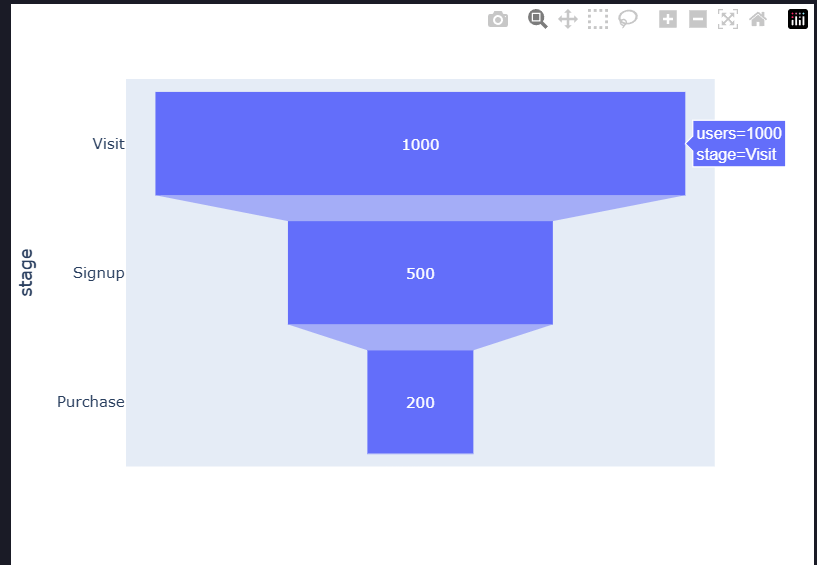
# 9. Funnel Chart
```python theme={null}
data = dict(
stage=["Visit","Signup","Purchase"],
users=[1000,500,200]
)
fig = px.funnel(
data,
x="users",
y="stage"
)
```
 ***
# 10. Density Heatmap
```python theme={null}
fig = px.density_heatmap(
df,
x="gdpPercap",
y="lifeExp"
)
```
***
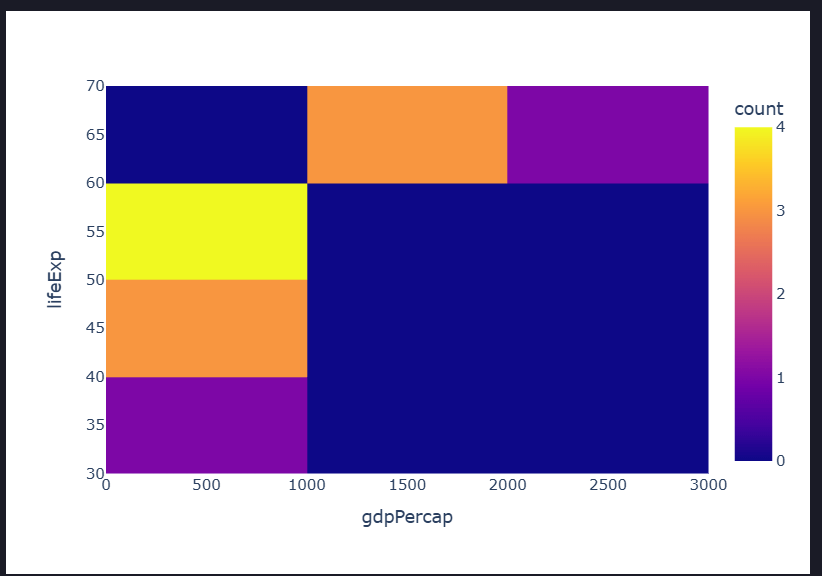
# 10. Density Heatmap
```python theme={null}
fig = px.density_heatmap(
df,
x="gdpPercap",
y="lifeExp"
)
```
 ***
# 11. Density Contour
```python theme={null}
fig = px.density_contour(
df,
x="gdpPercap",
y="lifeExp"
)
```
***
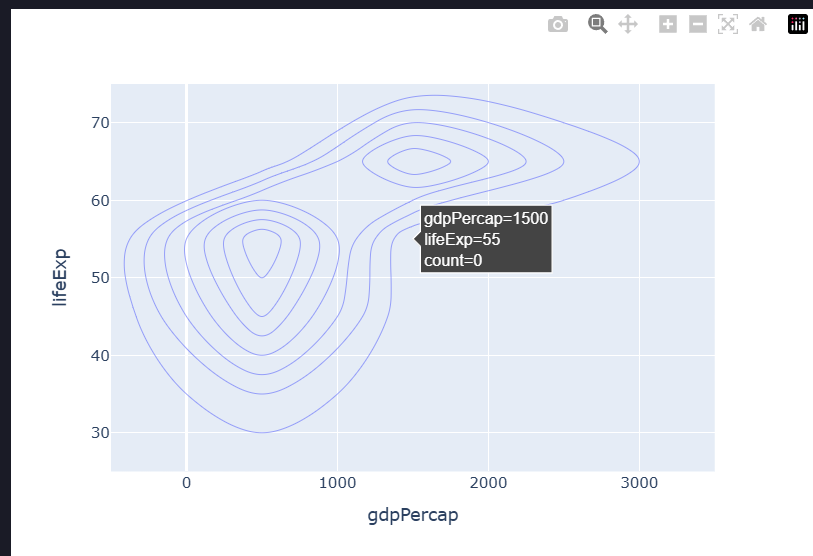
# 11. Density Contour
```python theme={null}
fig = px.density_contour(
df,
x="gdpPercap",
y="lifeExp"
)
```
 ***
# 12. Choropleth Map
```python theme={null}
fig = px.choropleth(
df,
locations="iso_alpha",
color="lifeExp"
)
```
***
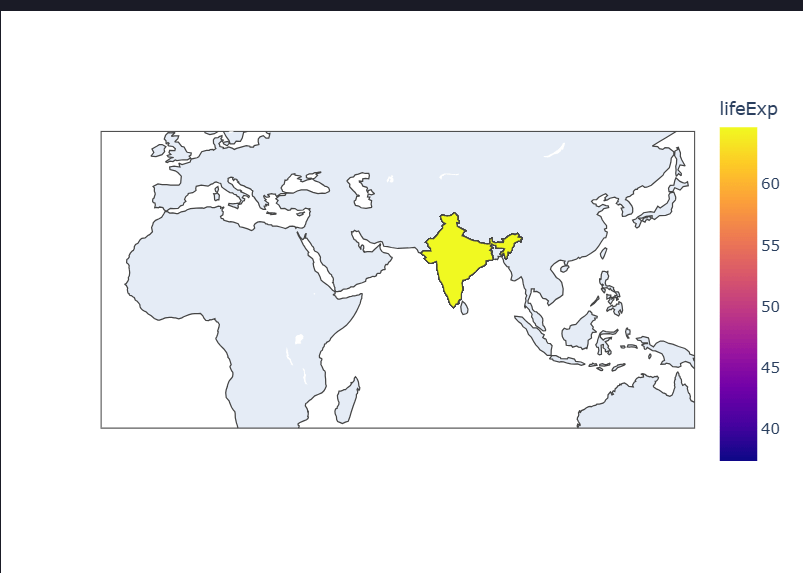
# 12. Choropleth Map
```python theme={null}
fig = px.choropleth(
df,
locations="iso_alpha",
color="lifeExp"
)
```
 ***
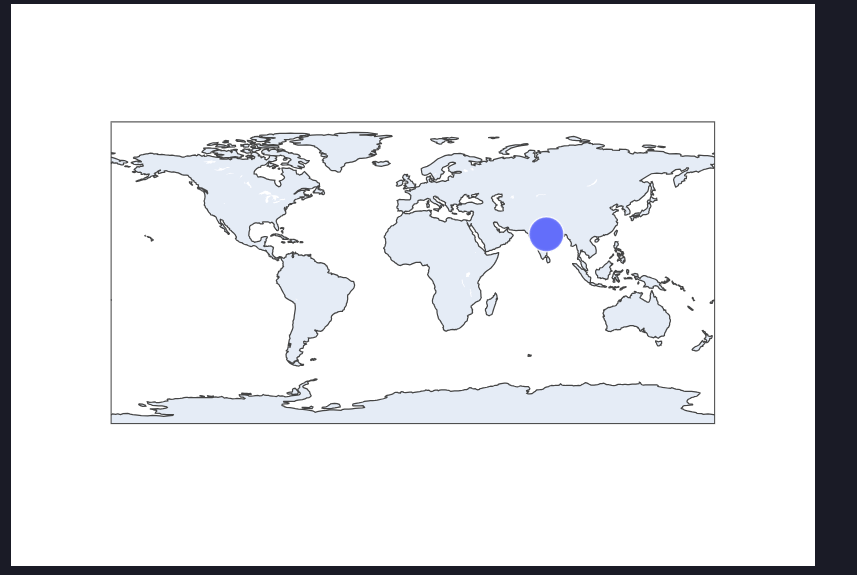
# 13. Scatter Geo
```python theme={null}
fig = px.scatter_geo(
df,
locations="iso_alpha",
size="pop"
)
```
***
# 13. Scatter Geo
```python theme={null}
fig = px.scatter_geo(
df,
locations="iso_alpha",
size="pop"
)
```
 ***
# 14. Timeline Chart
```python theme={null}
import pandas as pd
data = pd.DataFrame({
"Task":["A","B"],
"Start":["2024-01-01","2024-03-01"],
"Finish":["2024-02-01","2024-05-01"]
})
fig = px.timeline(
data,
x_start="Start",
x_end="Finish",
y="Task"
)
```
***
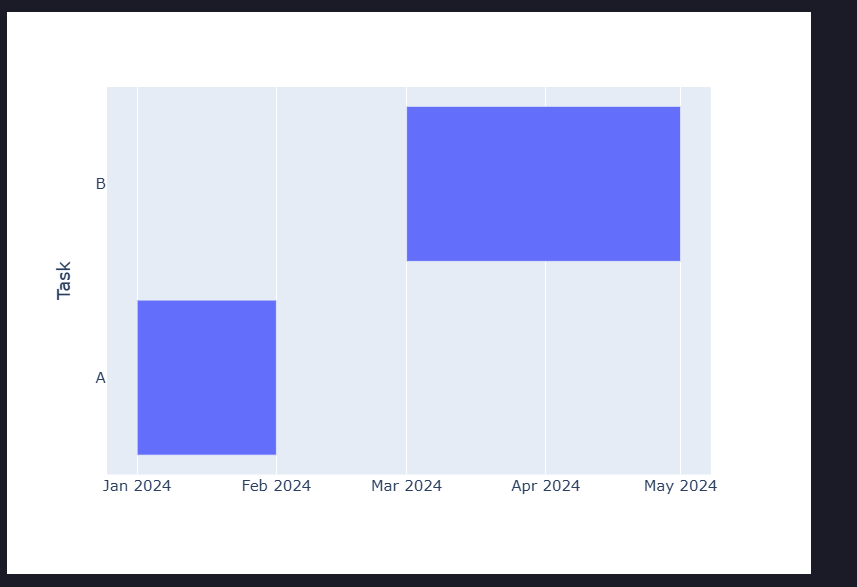
# 14. Timeline Chart
```python theme={null}
import pandas as pd
data = pd.DataFrame({
"Task":["A","B"],
"Start":["2024-01-01","2024-03-01"],
"Finish":["2024-02-01","2024-05-01"]
})
fig = px.timeline(
data,
x_start="Start",
x_end="Finish",
y="Task"
)
```
 ***
# 15. Polar Chart
```python theme={null}
fig = px.line_polar(
r=[1,2,3],
theta=[0,90,180]
)
```
***
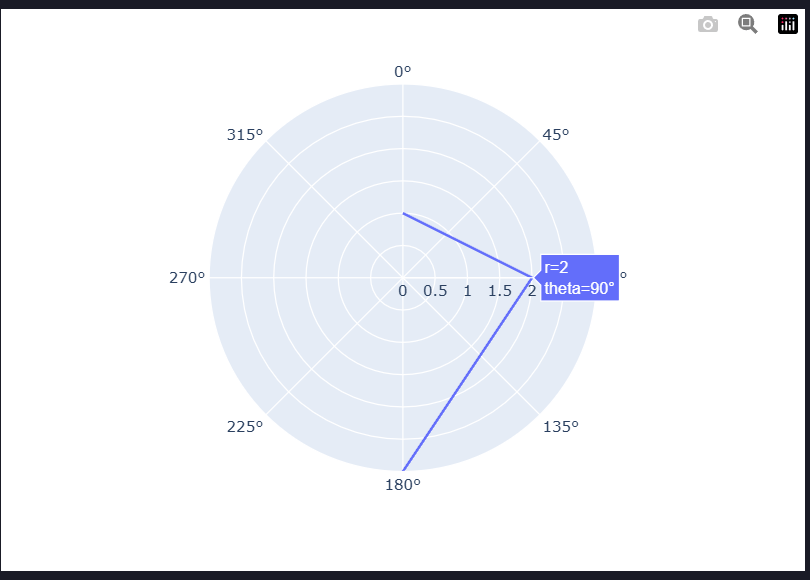
# 15. Polar Chart
```python theme={null}
fig = px.line_polar(
r=[1,2,3],
theta=[0,90,180]
)
```
 ***
# 16. Radar Chart
```python theme={null}
fig = go.Figure()
fig.add_trace(go.Scatterpolar(
r=[5,4,3,4],
theta=['Math','Physics','Chemistry','English'],
fill='toself'
))
fig.show()
```
***
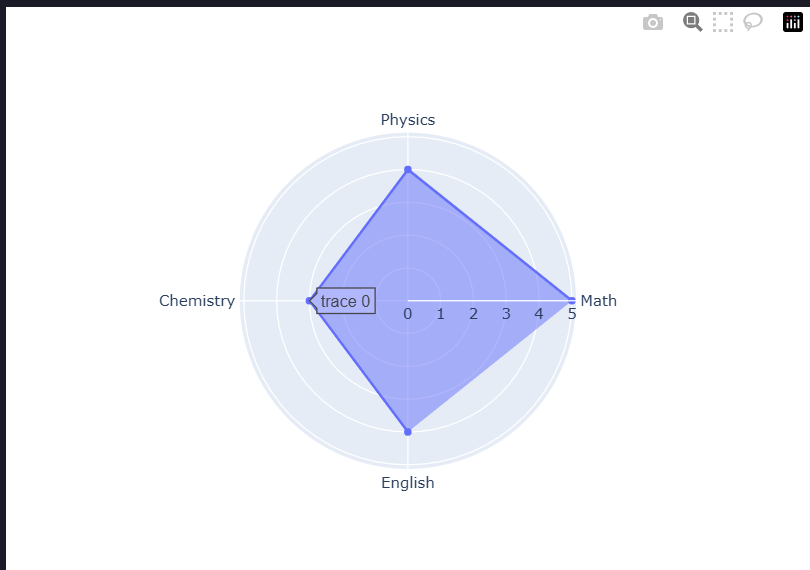
# 16. Radar Chart
```python theme={null}
fig = go.Figure()
fig.add_trace(go.Scatterpolar(
r=[5,4,3,4],
theta=['Math','Physics','Chemistry','English'],
fill='toself'
))
fig.show()
```
 ***
# 17. 3D Scatter Plot
```python theme={null}
fig = px.scatter_3d(
df,
x="gdpPercap",
y="lifeExp",
z="pop"
)
```
***
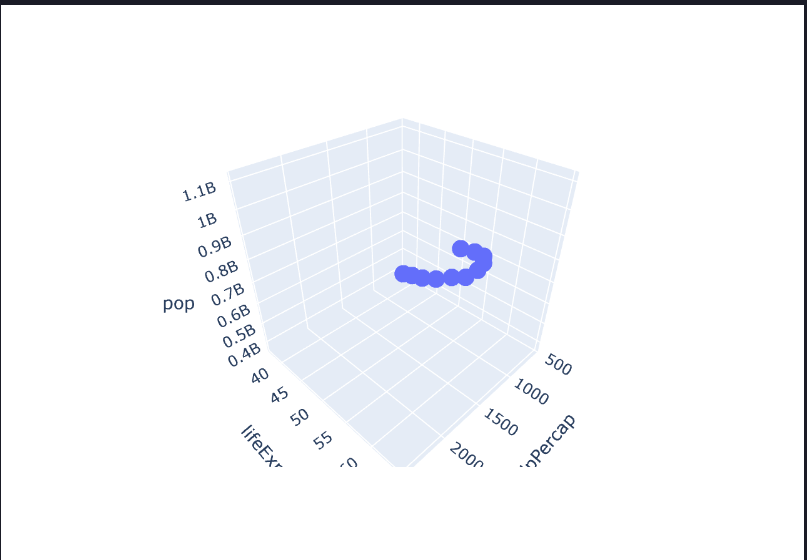
# 17. 3D Scatter Plot
```python theme={null}
fig = px.scatter_3d(
df,
x="gdpPercap",
y="lifeExp",
z="pop"
)
```
 ***
# 18. 3D Line Plot
```python theme={null}
fig = px.line_3d(
df,
x="year",
y="lifeExp",
z="pop"
)
```
***
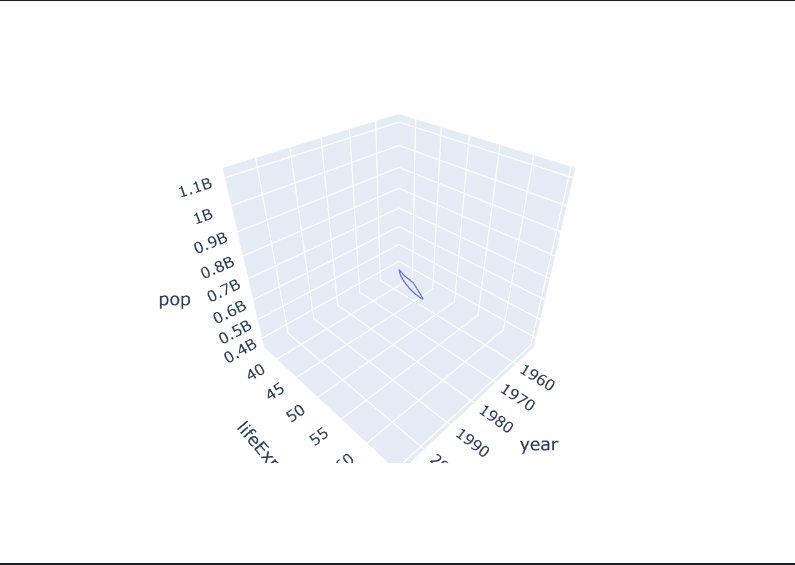
# 18. 3D Line Plot
```python theme={null}
fig = px.line_3d(
df,
x="year",
y="lifeExp",
z="pop"
)
```
 ***
# 19. Surface Plot
```python theme={null}
import numpy as np
z = np.random.rand(10,10)
fig = go.Figure(
data=[go.Surface(z=z)]
)
```
***
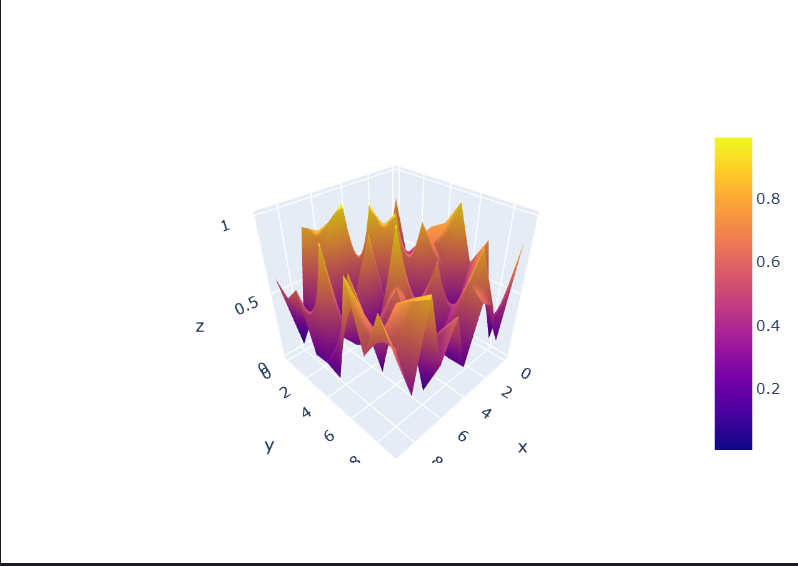
# 19. Surface Plot
```python theme={null}
import numpy as np
z = np.random.rand(10,10)
fig = go.Figure(
data=[go.Surface(z=z)]
)
```
 ***
# 20. Mesh3D
```python theme={null}
fig = go.Figure(
data=[go.Mesh3d(
x=[0,1,2],
y=[0,1,0],
z=[0,1,2]
)]
)
```
***
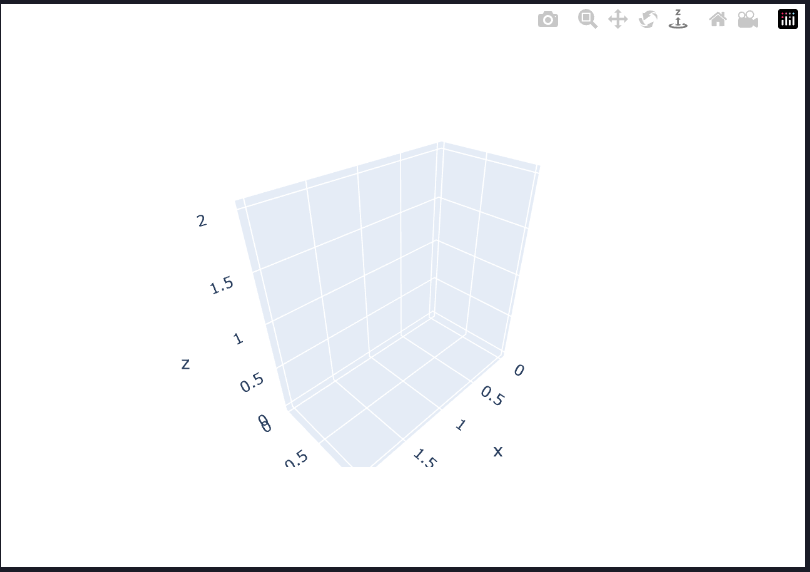
# 20. Mesh3D
```python theme={null}
fig = go.Figure(
data=[go.Mesh3d(
x=[0,1,2],
y=[0,1,0],
z=[0,1,2]
)]
)
```
 ***
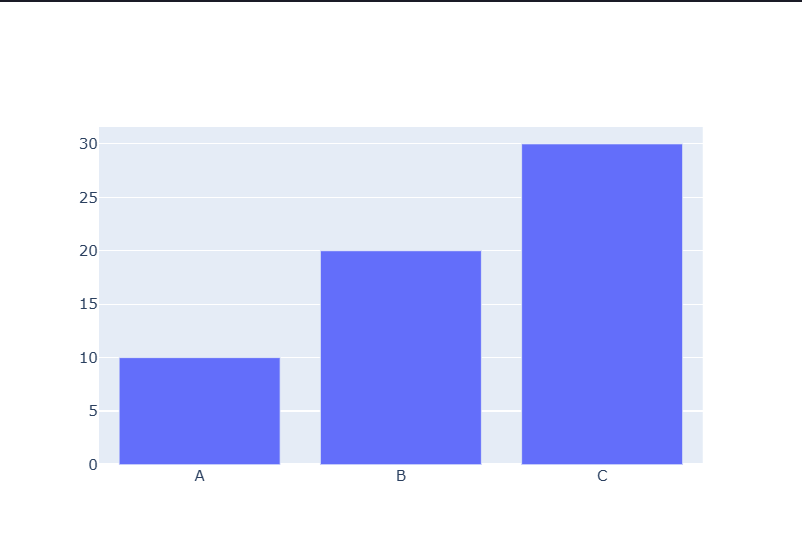
# 21. Graph Objects
Graph Objects provide full control.
```python theme={null}
import plotly.graph_objects as go
fig = go.Figure()
fig.add_trace(
go.Bar(
x=["A","B","C"],
y=[10,20,30]
)
)
fig.show()
```
***
# 21. Graph Objects
Graph Objects provide full control.
```python theme={null}
import plotly.graph_objects as go
fig = go.Figure()
fig.add_trace(
go.Bar(
x=["A","B","C"],
y=[10,20,30]
)
)
fig.show()
```
 ***
# 22. Figure Layout
```python theme={null}
fig.update_layout(
title="Sales Report",
xaxis_title="Month",
yaxis_title="Sales",
template="plotly_dark"
)
```
***
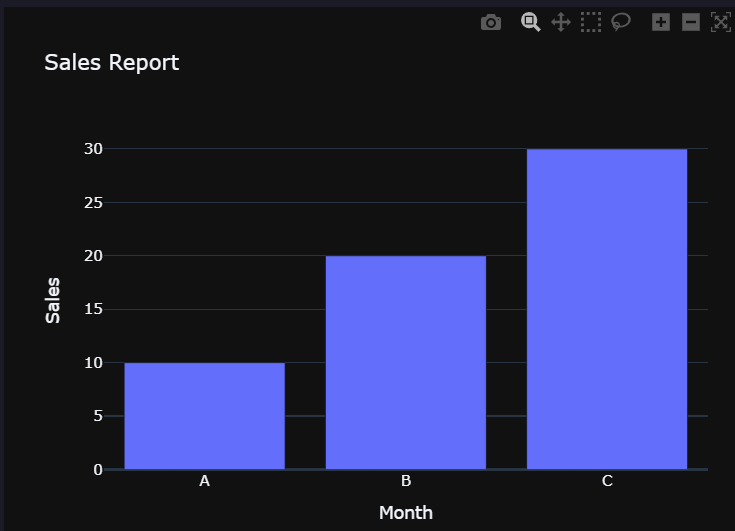
# 22. Figure Layout
```python theme={null}
fig.update_layout(
title="Sales Report",
xaxis_title="Month",
yaxis_title="Sales",
template="plotly_dark"
)
```
 ***
# 23. Templates
```python theme={null}
template="plotly"
template="plotly_dark"
template="ggplot2"
template="seaborn"
template="simple_white"
```
***
# 24. Multiple Traces
```python theme={null}
fig = go.Figure()
fig.add_trace(
go.Scatter(
x=[1,2,3],
y=[4,5,6]
)
)
fig.add_trace(
go.Scatter(
x=[1,2,3],
y=[6,5,4]
)
)
```
***
# 23. Templates
```python theme={null}
template="plotly"
template="plotly_dark"
template="ggplot2"
template="seaborn"
template="simple_white"
```
***
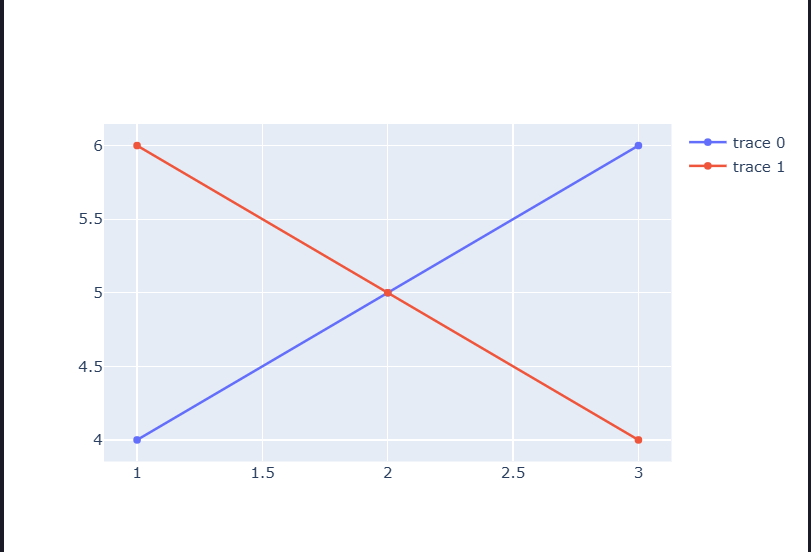
# 24. Multiple Traces
```python theme={null}
fig = go.Figure()
fig.add_trace(
go.Scatter(
x=[1,2,3],
y=[4,5,6]
)
)
fig.add_trace(
go.Scatter(
x=[1,2,3],
y=[6,5,4]
)
)
```
 ***
# 25. Subplots
```python theme={null}
from plotly.subplots import make_subplots
fig = make_subplots(
rows=1,
cols=2
)
fig.add_trace(
go.Bar(
x=[1,2],
y=[3,4]
),
row=1,
col=1
)
fig.show()
```
***
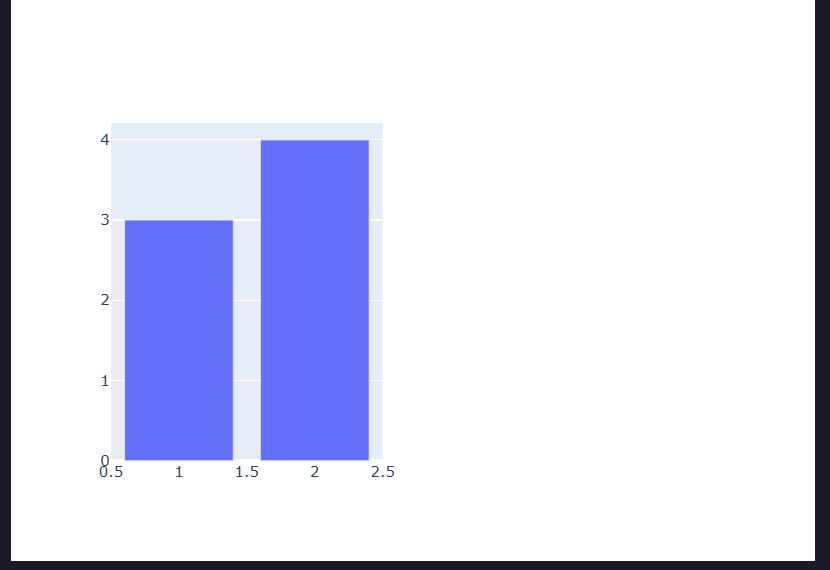
# 25. Subplots
```python theme={null}
from plotly.subplots import make_subplots
fig = make_subplots(
rows=1,
cols=2
)
fig.add_trace(
go.Bar(
x=[1,2],
y=[3,4]
),
row=1,
col=1
)
fig.show()
```
 ***
# 26. Update Traces
```python theme={null}
fig.update_traces(
marker_color="red",
marker_size=12
)
```
***
# 27. Update Axes
```python theme={null}
fig.update_xaxes(title="Year")
fig.update_yaxes(title="Population")
```
***
# 28. Hover Information
```python theme={null}
fig.update_traces(
hovertemplate="%{x}
***
# 26. Update Traces
```python theme={null}
fig.update_traces(
marker_color="red",
marker_size=12
)
```
***
# 27. Update Axes
```python theme={null}
fig.update_xaxes(title="Year")
fig.update_yaxes(title="Population")
```
***
# 28. Hover Information
```python theme={null}
fig.update_traces(
hovertemplate="%{x}
%{y}"
)
```
***
# 29. Annotations
```python theme={null}
fig.add_annotation(
x=2,
y=5,
text="Peak"
)
```
***
# 30. Shapes
Rectangle:
```python theme={null}
fig.add_shape(
type="rect",
x0=1,
y0=2,
x1=3,
y1=5
)
```
Line:
```python theme={null}
fig.add_shape(
type="line",
x0=0,
y0=0,
x1=5,
y1=5
)
```
***
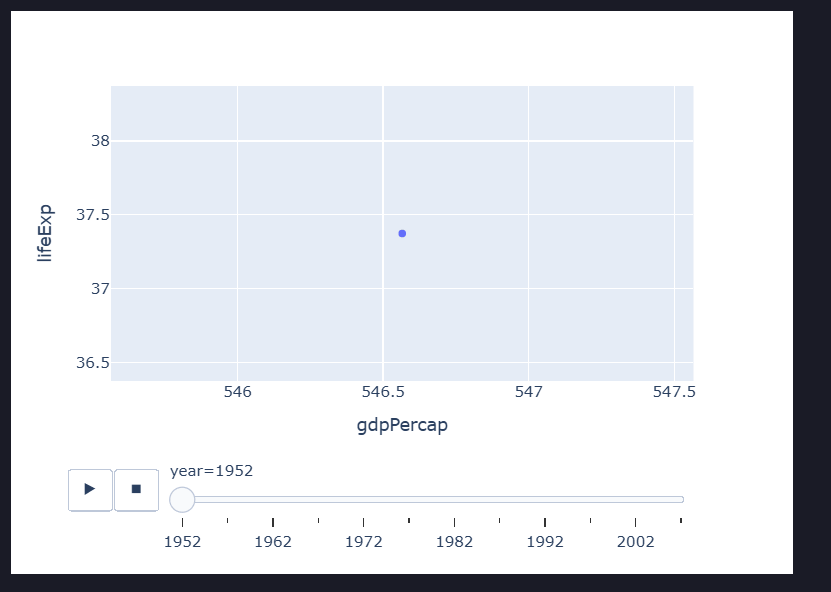
# 31. Animation
```python theme={null}
fig = px.scatter(
df,
x="gdpPercap",
y="lifeExp",
animation_frame="year"
)
```
 ***
# 32. Export Graph
HTML:
```python theme={null}
fig.write_html("graph.html")
```
PNG:
```python theme={null}
fig.write_image("graph.png")
```
(Requires the `kaleido` package.)
***
# 33. Display Figure
```python theme={null}
fig.show()
```
***
# 34. Common Plotly Express Parameters
| Parameter | Description |
| ---------------- | --------------------- |
| data\_frame | Input dataset |
| x | X-axis column |
| y | Y-axis column |
| color | Color grouping |
| size | Bubble size |
| symbol | Marker shape |
| title | Chart title |
| labels | Axis labels |
| hover\_name | Main hover text |
| hover\_data | Additional hover data |
| facet\_row | Row-wise facets |
| facet\_col | Column-wise facets |
| animation\_frame | Animation step |
| animation\_group | Object tracking |
| template | Theme |
| width | Figure width |
| height | Figure height |
***
# 35. Common Graph Objects
* `go.Scatter`
* `go.Bar`
* `go.Pie`
* `go.Box`
* `go.Violin`
* `go.Histogram`
* `go.Heatmap`
* `go.Surface`
* `go.Mesh3d`
* `go.Scatter3d`
* `go.Scatterpolar`
* `go.Indicator`
* `go.Table`
* `go.Funnel`
***
# 36. Advantages of Plotly
* Interactive visualizations
* Browser-based rendering
* Publication-quality graphics
* Supports 2D and 3D charts
* Easy integration with Dash
* Highly customizable
* Animation support
* Hover tooltips and zooming
* Export to HTML and images
***
# 37. Limitations
* Can be slower with very large datasets
* More memory-intensive than static libraries
* Some advanced exports require additional packages (such as `kaleido`)
***
# 38. Plotly vs Matplotlib
| Feature | Plotly | Matplotlib |
| ------------------ | ---------------- | -------------- |
| Interactive | ✅ | ❌ (by default) |
| 3D Support | ✅ | ✅ |
| Animation | ✅ | ✅ |
| Web Integration | Excellent | Limited |
| Learning Curve | Easy to Moderate | Moderate |
| Static Publication | Good | Excellent |
| Dashboards | Excellent | Limited |
***
# 39. Summary
* **Plotly Express (`px`)** is ideal for quickly creating interactive charts.
* **Graph Objects (`go`)** provide fine-grained control and customization.
* **Key chart types:** Line, Scatter, Bar, Pie, Histogram, Box, Violin, Heatmap, Treemap, Sunburst, Funnel, Timeline, Polar, 3D Scatter, Surface, Mesh3D, and Geographic Maps.
* **Core workflow:** Create a `Figure`, add traces (if using `go`), customize with `update_layout()`, `update_traces()`, and `update_xaxes()/update_yaxes()`, then display with `fig.show()` or export with `write_html()`/`write_image()`.
***
# 32. Export Graph
HTML:
```python theme={null}
fig.write_html("graph.html")
```
PNG:
```python theme={null}
fig.write_image("graph.png")
```
(Requires the `kaleido` package.)
***
# 33. Display Figure
```python theme={null}
fig.show()
```
***
# 34. Common Plotly Express Parameters
| Parameter | Description |
| ---------------- | --------------------- |
| data\_frame | Input dataset |
| x | X-axis column |
| y | Y-axis column |
| color | Color grouping |
| size | Bubble size |
| symbol | Marker shape |
| title | Chart title |
| labels | Axis labels |
| hover\_name | Main hover text |
| hover\_data | Additional hover data |
| facet\_row | Row-wise facets |
| facet\_col | Column-wise facets |
| animation\_frame | Animation step |
| animation\_group | Object tracking |
| template | Theme |
| width | Figure width |
| height | Figure height |
***
# 35. Common Graph Objects
* `go.Scatter`
* `go.Bar`
* `go.Pie`
* `go.Box`
* `go.Violin`
* `go.Histogram`
* `go.Heatmap`
* `go.Surface`
* `go.Mesh3d`
* `go.Scatter3d`
* `go.Scatterpolar`
* `go.Indicator`
* `go.Table`
* `go.Funnel`
***
# 36. Advantages of Plotly
* Interactive visualizations
* Browser-based rendering
* Publication-quality graphics
* Supports 2D and 3D charts
* Easy integration with Dash
* Highly customizable
* Animation support
* Hover tooltips and zooming
* Export to HTML and images
***
# 37. Limitations
* Can be slower with very large datasets
* More memory-intensive than static libraries
* Some advanced exports require additional packages (such as `kaleido`)
***
# 38. Plotly vs Matplotlib
| Feature | Plotly | Matplotlib |
| ------------------ | ---------------- | -------------- |
| Interactive | ✅ | ❌ (by default) |
| 3D Support | ✅ | ✅ |
| Animation | ✅ | ✅ |
| Web Integration | Excellent | Limited |
| Learning Curve | Easy to Moderate | Moderate |
| Static Publication | Good | Excellent |
| Dashboards | Excellent | Limited |
***
# 39. Summary
* **Plotly Express (`px`)** is ideal for quickly creating interactive charts.
* **Graph Objects (`go`)** provide fine-grained control and customization.
* **Key chart types:** Line, Scatter, Bar, Pie, Histogram, Box, Violin, Heatmap, Treemap, Sunburst, Funnel, Timeline, Polar, 3D Scatter, Surface, Mesh3D, and Geographic Maps.
* **Core workflow:** Create a `Figure`, add traces (if using `go`), customize with `update_layout()`, `update_traces()`, and `update_xaxes()/update_yaxes()`, then display with `fig.show()` or export with `write_html()`/`write_image()`.