> ## Documentation Index
> Fetch the complete documentation index at: https://ai.tharung.in/llms.txt
> Use this file to discover all available pages before exploring further.
# Core ML
Machine Learning (ML) is a branch of Artificial Intelligence where systems learn patterns from data and improve predictions or decisions without being explicitly programmed for every rule.
***
# What is Machine Learning?
Traditional programming:
```text theme={null}
Input + Rules → Output
```
Machine Learning:
```text theme={null}
Input + Output Data → Model learns Rules
```
Example:
Spam Email Detection
Traditional approach:
```text theme={null}
if email contains "lottery":
spam=True
```
Machine Learning approach:
```text theme={null}
Provide thousands of spam and non-spam emails
Model learns patterns automatically
```
***
# Why Machine Learning?
Machine learning is useful when:
* Rules are too complex
* Huge amounts of data exist
* Patterns continuously change
* Manual programming becomes difficult
Examples:
* Netflix recommendations
* Self-driving cars
* Fraud detection
* Face recognition
* ChatGPT
* YouTube recommendations
***
# Machine Learning Pipeline
Typical workflow:
```text theme={null}
Collect Data
↓
Clean Data
↓
Feature Engineering
↓
Split Data
↓
Train Model
↓
Evaluate Model
↓
Tune Model
↓
Deploy Model
```
***
# Types of Machine Learning
Machine Learning mainly has three types:
```text theme={null}
1. Supervised Learning
2. Unsupervised Learning
3. Reinforcement Learning
```
***
# 1. Supervised Learning
## What is Supervised Learning?
The model learns from labeled data.
Labeled data:
```text theme={null}
Input → Output
```
Example:
```text theme={null}
House Area → House Price
1000 sqft → ₹20 lakh
1200 sqft → ₹25 lakh
1500 sqft → ₹30 lakh
```
The model learns:
```text theme={null}
Area → Price relationship
```
After learning:
```text theme={null}
1700 sqft → ?
```
Model predicts answer.
***
## Types of Supervised Learning
Two major types:
```text theme={null}
1. Regression
2. Classification
```
***
## Regression
Predicts continuous numerical values.
Examples:
* House price prediction
* Stock price prediction
* Temperature prediction
* Sales forecasting
Output:
```text theme={null}
₹25,43,000
72.5°C
50.8
```
Algorithms:
* Linear Regression
* Random Forest Regressor
* XGBoost
* Decision Tree Regressor
***
## Classification
Predicts categories/classes.
Examples:
* Spam or Not Spam
* Disease Detection
* Fraud Detection
* Cat vs Dog
Output:
```text theme={null}
Spam
Fraud
Cat
```
Algorithms:
* Logistic Regression
* Decision Trees
* Random Forest
* SVM
* Neural Networks
***
## Supervised Learning Flow
```text theme={null}
Input Data
↓
Learn patterns
↓
Predict outputs
```
Example:
Student marks prediction:
| Hours Studied | Marks |
| :------------ | :---- |
| 2 | 40 |
| 4 | 60 |
| 6 | 75 |
Predict:
```text theme={null}
8 hours → ?
```
***
## Advantages
* Easy to evaluate
* High accuracy with enough labeled data
* Clear target output
## Disadvantages
* Requires large labeled datasets
* Labeling data is expensive
* Can overfit
***
# 2. Unsupervised Learning
## What is Unsupervised Learning?
Learns from unlabeled data.
No correct outputs exist.
Input:
```text theme={null}
Only data
```
Example:
Customer purchase data:
```text theme={null}
Age
Salary
Products Bought
```
Model discovers hidden patterns.
***
## Types of Unsupervised Learning
Main categories:
```text theme={null}
1. Clustering
2. Dimensionality Reduction
3. Association Rule Learning
```
***
## Clustering
Groups similar data points.
Example:
Customer segmentation:
```text theme={null}
Group 1 → Students
Group 2 → Working professionals
Group 3 → Senior citizens
```
Algorithms:
* K-Means
* DBSCAN
* Hierarchical Clustering
Applications:
* Customer segmentation
* Fraud detection
* Image segmentation
***
## Dimensionality Reduction
Reduces features while preserving information.
Example:
Dataset:
```text theme={null}
Height
Weight
Age
BMI
```
Some columns may be highly related.
Reduce:
```text theme={null}
4 features → 2 features
```
Algorithms:
* PCA
* t-SNE
Applications:
* Faster training
* Visualization
* Noise reduction
***
## Association Rule Learning
Finds relationships among items.
Example:
```text theme={null}
People buying bread also buy milk
```
Applications:
* Product recommendation
* Market basket analysis
Algorithms:
* Apriori
* FP Growth
***
## Advantages
* No labeled data needed
* Finds hidden patterns
## Disadvantages
* Hard to evaluate
* Interpretation may be difficult
***
# 3. Reinforcement Learning (RL)
## What is Reinforcement Learning?
Learning by interacting with an environment.
Agent learns through:
```text theme={null}
Actions → Rewards → Learning
```
***
## RL Components
### Agent
The learner
Examples:
```text theme={null}
Robot
Game AI
Self-driving car
```
***
### Environment
Where agent acts.
Examples:
```text theme={null}
Chess board
Road
Game world
```
***
### State
Current situation.
Example:
```text theme={null}
Robot location
```
***
### Action
What agent can do.
Example:
```text theme={null}
Move left
Move right
Jump
```
***
### Reward
Feedback after action.
Example:
```text theme={null}
+10 → good move
−5 → bad move
```
***
## Reinforcement Learning Flow
```text theme={null}
Agent
↓
Take Action
↓
Environment changes
↓
Reward received
↓
Learn from reward
↓
Repeat
```
***
## Example: Self-driving Car
State:
```text theme={null}
Traffic signal = Red
```
Action:
```text theme={null}
Stop
```
Reward:
```text theme={null}
+10
```
Wrong action:
```text theme={null}
Move forward
```
Reward:
```text theme={null}
−100
```
***
## Algorithms
* Q-Learning
* Deep Q Network (DQN)
* SARSA
* PPO
* Policy Gradient
***
## Applications
* Robotics
* Self-driving vehicles
* Game AI
* Trading systems
* Recommendation systems
***
## Advantages
* Learns automatically
* Handles complex environments
## Disadvantages
* Requires large training time
* High computational cost
***
# Comparison of ML Types
| Feature | Supervised | Unsupervised | Reinforcement |
| :----------- | :------------- | :---------------- | :---------------- |
| Labeled Data | Yes | No | Reward Signal |
| Goal | Predict output | Find patterns | Maximize reward |
| Example | Spam detection | Customer grouping | Self-driving cars |
| Output | Prediction | Groups/patterns | Actions |
***
# Important ML Terms
## Features
Input variables used for prediction.
Example:
```text theme={null}
Area
Bedrooms
Age
```
***
## Labels
Expected output.
Example:
```text theme={null}
House price
```
***
## Dataset
Collection of records.
Example:
| Area | Bedrooms | Price |
| :--- | :------- | :---- |
| 1200 | 3 | 25L |
| 1500 | 4 | 35L |
***
## Training Data
Data used to train model.
***
## Test Data
Data used to evaluate model.
***
## Model
Mathematical representation learned from data.
***
## Prediction
Output produced by model.
***
## Overfitting
Model memorizes training data.
Problem:
```text theme={null}
High training accuracy
Low testing accuracy
```
***
## Underfitting
Model fails to learn patterns.
Problem:
```text theme={null}
Low training accuracy
Low testing accuracy
```
# Train / Validation / Test, Overfitting, Bias–Variance Tradeoff
***
# Why Do We Split Data?
Suppose we train a model using all available data:
```text theme={null}
Entire Data
↓
Train Model
↓
Evaluate on same data
```
Problem:
```text theme={null}
Model may memorize data
```
The model can show:
```text theme={null}
Training Accuracy = 99%
```
but for new unseen data:
```text theme={null}
Real-world Accuracy = 50%
```
To avoid this problem, data is split.
***
# Dataset Split
Usually:
```text theme={null}
Dataset
↓
Train Data
Validation Data
Test Data
```
Common split:
```text theme={null}
Training → 70%
Validation → 15%
Testing → 15%
```
or
```text theme={null}
Training → 80%
Validation → 10%
Testing → 10%
```
***
# Train Dataset
## What is it?
Training data is used to teach the model patterns.
Example:
House Price Dataset:
| Area | Bedrooms | Price |
| :--- | :------- | :---- |
| 1200 | 3 | 25L |
| 1500 | 4 | 35L |
| 1800 | 4 | 40L |
The model learns:
```text theme={null}
Area + Bedrooms
↓
Price
```
***
## Purpose
* Learn relationships
* Update model weights
* Fit the model
***
## Example
```python theme={null}
X_train=[
[1200,3],
[1500,4],
[1800,4]
]
y_train=[
25,
35,
40
]
```
***
# Validation Dataset
## What is it?
Validation data is used during training to check model performance and tune settings.
Model does **not** learn from this data.
***
## Purpose
Used for:
* Hyperparameter tuning
* Model selection
* Detecting overfitting
Examples of hyperparameters:
```text theme={null}
Learning rate
Epochs
Tree depth
Batch size
```
***
## Example
Try different values:
```python theme={null}
learning_rate=0.001
learning_rate=0.01
learning_rate=0.1
```
Choose the best validation performance.
***
# Test Dataset
## What is it?
Test data evaluates final performance.
The model should never see test data during training.
***
## Purpose
Measures:
```text theme={null}
Real-world performance
```
***
Example:
```python theme={null}
X_test=[
[2000,5],
[2500,6]
]
y_test=[
50,
65
]
```
Prediction:
```python theme={null}
Predicted:
48
63
```
***
# Complete Flow
```text theme={null}
Raw Data
↓
Train Data
↓
Train Model
↓
Validation Data
↓
Tune Hyperparameters
↓
Final Model
↓
Test Data
↓
Final Accuracy
```
***
# Train-Test Split Using Scikit-Learn
Code:
```python theme={null}
from sklearn.model_selection import train_test_split
X=[1,2,3,4,5,6,7,8,9,10]
y=[0,1,0,1,0,1,0,1,0,1]
X_train,X_test,y_train,y_test= train_test_split(
X,
y,
test_size=0.2,
random_state=42
)
print(X_train)
print(X_test)
```
Possible Output:
```python theme={null}
X_train:
[6,1,8,3,10,5,4,7]
X_test:
[9,2]
```
***
# Train / Validation / Test Split
Code:
```python theme={null}
from sklearn.model_selection import train_test_split
X_train,X_temp,y_train,y_temp = train_test_split(
X,
y,
test_size=0.3,
random_state=42
)
X_val,X_test,y_val,y_test = train_test_split(
X_temp,
y_temp,
test_size=0.5,
random_state=42
)
print(len(X_train))
print(len(X_val))
print(len(X_test))
```
Output:
```python theme={null}
7
1
2
```
***
# Overfitting
## What is Overfitting?
The model memorizes training data instead of learning general patterns.
***
Example:
Training accuracy:
```text theme={null}
99%
```
Testing accuracy:
```text theme={null}
55%
```
***
Graph intuition:
```text theme={null}
Training Error
\
\
\
\
Validation Error
\
\
\
\__
\
\
```
Model becomes too complex and starts fitting noise.
***
## Causes
* Very complex model
* Small dataset
* Too many epochs
* Too many features
***
## Symptoms
```text theme={null}
High training accuracy
Low testing accuracy
```
***
## Example
Training data:
| Hours | Marks |
| :---- | :---- |
| 1 | 30 |
| 2 | 40 |
| 3 | 50 |
| 4 | 60 |
Model learns:
```text theme={null}
Perfect curve passing every point
```
Instead of:
```text theme={null}
General trend
```
***
## Reduce Overfitting
### 1. More data
```text theme={null}
Increase training examples
```
***
### 2. Regularization
Adds penalty.
Examples:
```text theme={null}
L1 Regularization
L2 Regularization
```
***
### 3. Dropout
Randomly removes neurons.
Used in:
```text theme={null}
Neural Networks
```
***
### 4. Reduce complexity
Example:
```text theme={null}
Reduce tree depth
```
***
### 5. Early stopping
Stop training when validation performance stops improving.
***
Example code:
```python theme={null}
from tensorflow.keras.callbacks import EarlyStopping
early=EarlyStopping(
monitor='val_loss',
patience=3
)
```
***
# Underfitting
## What is Underfitting?
Model fails to learn patterns.
***
Example:
Training accuracy:
```text theme={null}
50%
```
Testing accuracy:
```text theme={null}
48%
```
***
Symptoms:
```text theme={null}
Low training accuracy
Low testing accuracy
```
***
Causes:
* Model too simple
* Too few features
* Insufficient training
***
Solutions:
```text theme={null}
Increase complexity
Train longer
Add features
```
***
# Bias–Variance Tradeoff
This is one of the most important concepts in ML.
***
# What is Bias?
Bias measures error due to overly simple assumptions.
High bias:
```text theme={null}
Model oversimplifies
```
Example:
Trying to fit:
```text theme={null}
Curved data
```
using:
```text theme={null}
Straight line
```
***
Characteristics:
```text theme={null}
Low variance
High error
```
***
# What is Variance?
Variance measures sensitivity to small data changes.
High variance:
```text theme={null}
Model memorizes noise
```
Characteristics:
```text theme={null}
Low bias
High error on new data
```
***
# Relationship
```text theme={null}
High Bias
↓
Underfitting
Balanced Bias + Variance
↓
Good model
High Variance
↓
Overfitting
```
***
# Bias–Variance Curve
```text theme={null}
Error
^
|
|\
| \
| \
| \____
| \__
|
+-----------------> Model Complexity
```
Explanation:
Left side:
```text theme={null}
High bias
Underfitting
```
Middle:
```text theme={null}
Optimal point
```
Right side:
```text theme={null}
High variance
Overfitting
```
***
# Example
Suppose actual data:
```text theme={null}
Hours Studied → Marks
```
### High Bias
Model:
```text theme={null}
Marks = Hours
```
Too simple.
***
### Balanced
Model:
```text theme={null}
Learns trend
```
***
### High Variance
Model:
```text theme={null}
Fits every tiny fluctuation
```
***
# Visual Example with Polynomial Regression
Code:
```python theme={null}
import numpy as np
import matplotlib.pyplot as plt
from sklearn.preprocessing import PolynomialFeatures
from sklearn.linear_model import LinearRegression
x=np.array([1,2,3,4,5]).reshape(-1,1)
y=np.array([1,4,9,16,25])
poly=PolynomialFeatures(degree=4)
x_poly=poly.fit_transform(x)
model=LinearRegression()
model.fit(x_poly,y)
pred=model.predict(x_poly)
plt.scatter(x,y)
plt.plot(x,pred)
plt.show()
```
Output:
```text theme={null}
Shows fitted curve
```
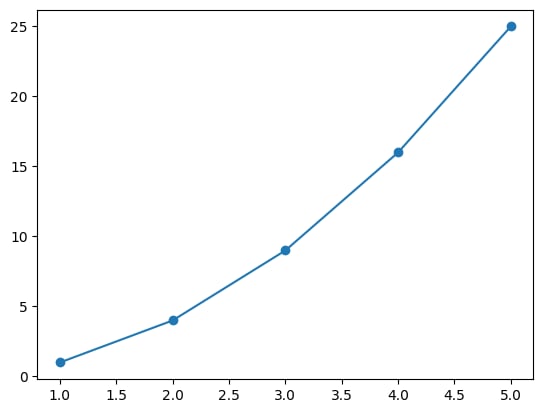 If degree becomes very high:
```text theme={null}
degree=20
```
Model starts overfitting.
***
# Training vs Validation Loss
Good model:
```text theme={null}
Epoch Train Loss Val Loss
1 0.8 0.9
2 0.6 0.7
3 0.4 0.5
4 0.3 0.35
```
***
Overfitting:
```text theme={null}
Epoch Train Loss Val Loss
1 0.8 0.9
2 0.5 0.6
3 0.2 0.8
4 0.1 1.4
```
Training improves but validation worsens.
***
# Quick Notes
```text theme={null}
Supervised:
Input + Correct Output
Regression:
Predict numbers
Classification:
Predict categories
Unsupervised:
Find hidden patterns
Clustering:
Group similar data
PCA:
Reduce dimensions
Reinforcement:
Learn using rewards
Features:
Inputs
Labels:
Outputs
Training Data:
Learn patterns
Validation Data:
Tune hyperparameters
Testing Data:
Final evaluation
Overfitting:
High train accuracy
Low test accuracy
Underfitting:
Low train accuracy
Low test accuracy
Bias:
Model too simple
Variance:
Model too sensitive
Bias + Variance:
Need balance
```
***
# PTR
**Why validation set?**
```text theme={null}
To tune hyperparameters without touching test data
```
**Why not use test data for training?**
```text theme={null}
Causes data leakage and unrealistic performance
```
**Signs of overfitting?**
```text theme={null}
High training accuracy
Low testing accuracy
```
**How to reduce overfitting?**
```text theme={null}
Regularization
Dropout
More data
Early stopping
Reduce complexity
```
**Bias vs Variance**
```text theme={null}
Bias → Underfitting
Variance → Overfitting
```
***
If degree becomes very high:
```text theme={null}
degree=20
```
Model starts overfitting.
***
# Training vs Validation Loss
Good model:
```text theme={null}
Epoch Train Loss Val Loss
1 0.8 0.9
2 0.6 0.7
3 0.4 0.5
4 0.3 0.35
```
***
Overfitting:
```text theme={null}
Epoch Train Loss Val Loss
1 0.8 0.9
2 0.5 0.6
3 0.2 0.8
4 0.1 1.4
```
Training improves but validation worsens.
***
# Quick Notes
```text theme={null}
Supervised:
Input + Correct Output
Regression:
Predict numbers
Classification:
Predict categories
Unsupervised:
Find hidden patterns
Clustering:
Group similar data
PCA:
Reduce dimensions
Reinforcement:
Learn using rewards
Features:
Inputs
Labels:
Outputs
Training Data:
Learn patterns
Validation Data:
Tune hyperparameters
Testing Data:
Final evaluation
Overfitting:
High train accuracy
Low test accuracy
Underfitting:
Low train accuracy
Low test accuracy
Bias:
Model too simple
Variance:
Model too sensitive
Bias + Variance:
Need balance
```
***
# PTR
**Why validation set?**
```text theme={null}
To tune hyperparameters without touching test data
```
**Why not use test data for training?**
```text theme={null}
Causes data leakage and unrealistic performance
```
**Signs of overfitting?**
```text theme={null}
High training accuracy
Low testing accuracy
```
**How to reduce overfitting?**
```text theme={null}
Regularization
Dropout
More data
Early stopping
Reduce complexity
```
**Bias vs Variance**
```text theme={null}
Bias → Underfitting
Variance → Overfitting
```
***